
Page 38 - MSAM-4-2
P. 38
Materials Science in Additive Manufacturing Measuring the porosity of AM components
roughness and adhesion force, which also cause buoyancy and sections perpendicular to the building direction (⊥) and thus
influence the measured values. The density values determined between the results of the gas pycnometer measurement and
38
using Archimedes’ method thus characterize the apparent Archimedes’ method. From this, true part densities of 4.83
part density (i.e., include the open pores in the measurement) – 4.90 g/cm³ can be derived from the sections parallel to the
and are therefore lower than the gas pycnometer values. With build direction and 4.79 – 4.82 g/cm³ perpendicular to it.
0.423 g/cm³ which is equivalent to 8.46%, the deviation from A small difference can therefore be seen within the micrograph
the theoretic reference density is over 18 times higher here analysis results. Sections parallel to the build direction have
than with gas pycnometry. At the same time, the resulting a higher density than perpendicular sections. According to
porosities are also significantly higher at approximately 8.2 Caminero et al., this can be explained by the orientation of
40
– 8.5%. For technical applications, however, this is usually the filament strands. Sections parallel to the build direction
the more important value for characterizing the stability of a cut the resulting filament strands horizontally, whereby a
component. Finally, comparable measured values have also relatively large amount of material and fewer pores are always
been determined previously using the Archimedes method. visible under the microscope. Vertical sections, on the other
39
The different component geometries have no influence here hand, cut these filament strands across the entire cross-section
either (max. 0.22% difference in density). of the component, which means that more pores are visible
The total porosity results of the micrograph analyses and therefore the porosity values are higher (Figure 9B). It is
are between 2.08% and 3.47% for sections parallel to the not easy to differentiate between filament matrix and pores,
building direction (∥) and between 3.51% and 4.18% for which means that measurement inaccuracies also have a
major influence with this measurement method (Figure 9,
A B C above). In addition, the porosity strongly depends on the
respective examined section plane and the measuring fields
under consideration and is therefore not representative of
the entire component, as completely different values can be
present just a few millimeters from the plane in which the cut
was being made. Overall, the values determined in this study
are within the range reported in the literature (Pellegrini et
al. and O’Connor et al. ) or only slightly higher. Ultimately,
31
32
D E F micrograph analysis is the only measuring method that can
optically visualize the actual porosity with open and closed
pores (at least in the area under consideration). However, the
component geometry cannot be meaningfully characterized
here, as the geometry is not depicted in the 2D section
examined. Micrograph analyses can also be used to assess
the size and morphology of the pores, which allows the
harmfulness of the pores to be estimated. Large and irregular
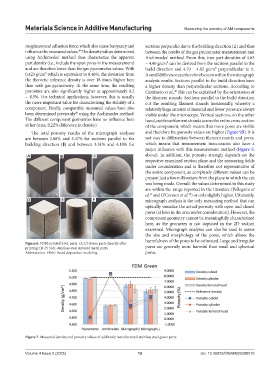
Figure 6. FDM-printed 316L parts. (A-C) Green parts directly after
printing; (D-F) 316L stainless steel sintered metal parts pores are generally more harmful than small and spherical
Abbreviation: FDM: Fused deposition modeling pores.
Figure 7. Measured density and porosity values of additively manufactured stainless steel green parts
Volume 4 Issue 2 (2025) 12 doi: 10.36922/MSAM025090010