
Page 43 - MSAM-4-2
P. 43
Materials Science in Additive Manufacturing Measuring the porosity of AM components
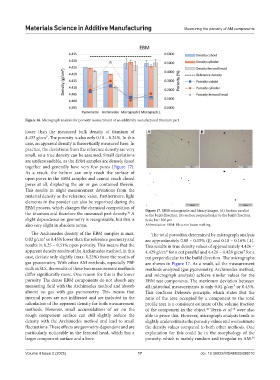
Figure 16. Micrograph analysis for porosity measurement of an additively manufactured titanium part
lower than the measured bulk density of titanium of A B
4.433 g/cm³. The porosity is also only 0.18 – 0.24%. In this
case, an apparent density is theoretically measured here. In
practice, the deviations from the reference density are very
small, so a true density can be assumed. Small deviations
are understandable, as the EBM samples are densely fused
together and generally have very few pores (Figure 17).
As a result, the helium can only reach the surface of
open pores in the EBM samples and cannot reach closed
pores at all, displacing the air or gas contained therein.
This results in slight measurement deviations from the
material density as the reference value. Furthermore, light
elements in the powder can also be vaporized during the
EBM process, which changes the chemical composition of Figure 17. EBM micrographs and binary images. (A) Section parallel
the titanium and therefore the measured part density. A to the build direction; (B) section perpendicular to the build direction.
38
slight dependence on geometry is recognizable, but this is Scale bar: 500 µm
also very slight in absolute terms. Abbreviation: EBM: Electron beam melting
The Archimedes density of the EBM samples is max. The total porosities determined by micrograph analysis
0.02 g/cm³ or 0.45% lower than the reference geometry and are approximately 0.08 – 0.15% (∥) and 0.10 – 0.16% (⊥).
results in 0.25 – 0.51% open porosity. This means that the This results in true density values of approximately 4.426 –
apparent density results of the Archimedes method, in this 4.429 g/cm³ for a cut parallel and 4.426 – 4.428 g/cm³ for a
case, deviate only slightly (max. 0.22%) from the results of cut perpendicular to the build direction. The micrographs
gas pycnometry. With other AM methods, especially PBF are shown in Figure 17. As a result, all the measurement
such as SLS, the results of these two measurement methods methods analyzed (gas pycnometry, Archimedes method,
differ significantly more. One reason for this is the lower and micrograph analysis) achieve similar values for the
porosity. The dense EBM components do not absorb any EBM test components. The maximum deviation between
measuring fluid with the Archimedes method and absorb all individual measurements is only 0.02 g/cm³ or 0.45%.
almost no gas with gas pycnometry. This means that This confirms Delesse’s principle, which states that the
internal pores are not infiltrated and are included in the ratio of the area occupied by a component to the total
calculation of the apparent density for both measurement profile area is a consistent estimate of the volume fraction
methods. However, small accumulations of air on the of the component in the object. Terris et al. were also
38
43
rough component surface can still slightly reduce the able to prove this. However, micrograph analysis tends to
density with the Archimedes method and lead to small slightly underestimate the porosity values and overestimate
fluctuations. These effects are geometry-dependent and are the density values compared to both other methods. One
particularly noticeable in the femoral head, which has a explanation for this could lie in the morphology of the
larger component surface and a bore. porosity, which is mainly random and irregular in AM.
38
Volume 4 Issue 2 (2025) 17 doi: 10.36922/MSAM025090010