
Page 44 - MSAM-4-2
P. 44
Materials Science in Additive Manufacturing Measuring the porosity of AM components
Another explanation could be that the porosity rate at the Individual component layers are not recognizable in any
sample surface or near the surface is generally higher, which of the designs.
is almost not considered in the micrograph analysis. The sintered ceramic components have an uneven
38
A special geometry-dependent influence may exist but surface quality (Figure 18D-F). Areas with material
cannot be explained comprehensibly with the micrograph adhesions and small cracks are clearly recognizable, but
analysis, as the component areas under consideration do there are also good areas without irregularities, which
not include the component geometry.
are relatively smooth. The components have also shrunk
4.1.4. LCM considerably as a result of the sintering process and the
burning out of the plastic content.
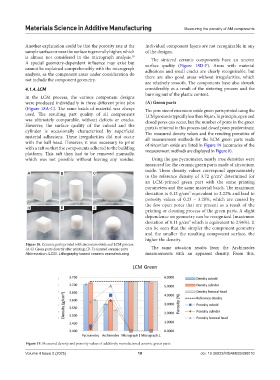
In the LCM process, the various component designs
were produced individually in three different print jobs (A) Green parts
(Figure 18A-C). The same batch of material was always The pore size of zirconium oxide green parts printed using the
used. The resulting part quality of all components LCM process is typically less than 50 μm. In principle, open and
was ultimately comparable, without defects or cracks. closed pores can occur, but the number of pores in the green
However, the surface quality of the cuboid and the parts is minimal in this process and closed pores predominate.
cylinder is occasionally characterized by superficial The measured density values and the resulting porosities of
material adhesions. These irregularities did not occur all measurement methods for the LCM green parts made
with the ball head. However, it was necessary to print of zirconium oxide are listed in Figure 19 (accuracies of the
with a raft so that the components adhered to the building measurement methods are displayed in Figure 8).
platform. This raft then had to be removed manually,
which was not possible without leaving any residue. Using the gas pycnometer, nearly true densities were
measured for the ceramic green parts made of zirconium
oxide. These density values correspond approximately
A B C
to the reference density of 3.72 g/cm³ determined for
an LCM-printed green part with the same printing
parameters and the same material batch. The maximum
deviation is 0.12 g/cm³ equivalent to 3.22% and lead to
porosity values of 0.23 – 3.28%, which are caused by
the few open pores that are present as a result of the
D E F
printing or cleaning process of the green parts. A slight
dependence on geometry can be recognized (maximum
deviation of 0.11 g/cm³ which is equivalent to 2.96%). It
can be seen that the simpler the component geometry
and the smaller the resulting component surface, the
higher the density.
Figure 18. Ceramic parts printed with zirconium oxide and LCM process.
(A-C) Green parts directly after printing; (D-F) sintered ceramic parts The same situation results from the Archimedes
Abbreviation: LCM: Lithography-based ceramic manufacturing measurements with an apparent density. From this,
Figure 19. Measured density and porosity values of additively manufactured ceramic green parts
Volume 4 Issue 2 (2025) 18 doi: 10.36922/MSAM025090010