
Page 45 - MSAM-4-2
P. 45
Materials Science in Additive Manufacturing Measuring the porosity of AM components
deviations of max. 0.19 g/cm³ or 5.10% from the to the build direction. This was then used to calculate a
reference density and porosities of 3.40 – 5.06% can be part density of exactly 3.72 g/cm³. For the LCM green
determined. The small deviation of 2.14% from the gas parts, micrograph analysis is therefore theoretically the
pycnometer measurements is understandable, as the few most accurate measurement method for determining part
and very small open pores cannot be measured with the density and porosity. Gas pycnometry and Archimedes’
Archimedes method and are therefore not included in method provide comparable, but usually slightly lower
the density determination. The apparent part density density values. However, it should again be noted that
is determined with a slightly lower density and higher only a specific area is considered here and not the entire
porosity. A geometry dependency can also be recognized component. The component geometry is therefore not
here, which is comparable in principle to the situation with considered here.
gas pycnometry.
(B) Sintered parts
The porosity in the green parts was then analyzed
optically using micrograph analysis. Very occasional pores By sintering the LCM green compacts, the pore size is
further reduced and is then in the range of 0.1 – 5 μm.
were discovered, but these were not significant in relation
to the entire field of investigation (Figure 20), as the Of the methods investigated in this work, only gas
porosity was 0.00% for all components, both in the sections pycnometry and buoyancy measurement are suitable for
perpendicular to the build direction and in those parallel taking the pores into account with sufficient accuracy in the
measurements. Micrograph analyses may be less accurate
for such small pore sizes. The sintering process typically
A B causes the pore structures to change somewhat. Open
pores close and closed pores become smaller, as individual
print layers also fuse and the component shrinks. The
measured density values and the determined porosities of
all measurement methods for the sintered LCM ceramic
components made of ZrO are listed in Figure 21. The
2
accuracies of the measurement methods are analyzed in
more detail in Figure 8.
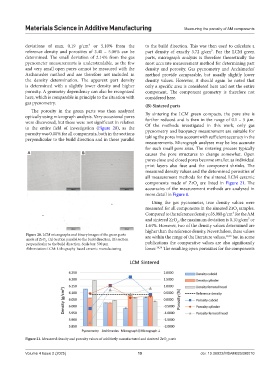
Using the gas pycnometer, true density values were
measured for all components in the sintered ZrO samples.
2
Compared to the reference density of 6.088 g/cm³ for the AM
and sintered ZrO , the maximum deviation is 0.10 g/cm³ or
2
1.64%. However, two of the density values determined are
higher than the reference density. Nevertheless, these values
Figure 20. LCM micrographs and binary images of the green parts are within the range of the literature values, 30,36 but in some
made of ZrO . (A) Section parallel to the build direction; (B) section
2
perpendicular to the build direction. Scale bar: 500 μm publications the comparative values are also significantly
Abbreviation: LCM: Lithography-based ceramic manufacturing lower. 28,29 The resulting open porosities for the components
Figure 21. Measured density and porosity values of additively manufactured and sintered ZrO parts
2
Volume 4 Issue 2 (2025) 19 doi: 10.36922/MSAM025090010