
Page 42 - MSAM-4-2
P. 42
Materials Science in Additive Manufacturing Measuring the porosity of AM components
and displace the air. This makes it possible to determine the A B
material density of the component, which is 1.065 g/cm³ for
the PA12 powder. The gas pycnometry of the PA12 samples
thus results in only 0.02 g/cm³ which is equivalent to
1.88% deviation from this reference, which leads to total
part porosities of 1.64 – 1.84% due to the comparatively
loose sintering of the powder particles. The values are
lower than the values collected in the literature, but these
22
results can only serve as a reference to a limited extent, as
the powder used, printing system and process parameters
differ, but these have a major influence on the resulting part
porosity. However, a slight difference in density between
the unprocessed reference powder and the sintered powder
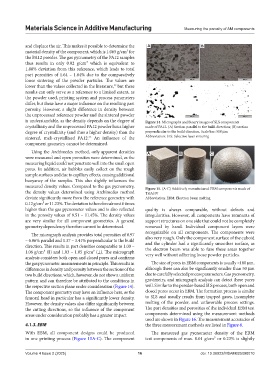
is understandable, as the density depends on the degree of Figure 14. Micrographs and binary images of SLS components
crystallinity and the unprocessed PA12 powder has a higher made of PA12. (A) Section parallel to the build direction; (B) section
degree of crystallinity (and thus a higher density) than the perpendicular to the build direction. Scale bar: 500 μm
22
sintered, melt-crystallized PA12. An influence of the Abbreviation: SLS: Selective laser sintering
component geometry cannot be determined.
Using the Archimedes method, only apparent densities A B C
were measured and open porosities were determined, as the
measuring liquid could not penetrate well into the small open
pores. In addition, air bubbles easily collect on the rough
sample surfaces and due to capillary effects, causing additional
buoyancy of the samples. This also slightly influences the
measured density values. Compared to the gas pycnometry, Figure 15. (A-C) Additively manufactured EBM components made of
the density values determined using Archimedes method Ti6Al4V
deviate significantly more from the reference geometry with Abbreviation: EBM: Electron beam melting
0.12 g/cm³ or 11.23%. The deviation is therefore almost 6 times
higher than the gas pycnometer values and is also reflected quality is always comparable, without defects and
in the porosity values of 9.51 – 11.45%. The density values irregularities. However, all components have remnants of
are very similar for all component geometries. A general support structures on one side that could not be completely
geometry dependency therefore cannot be determined. removed by hand. Individual component layers were
The micrograph analysis provides total porosities of 0.97 recognizable on all components. The components were
– 6.06% parallel and 1.37 – 3.41% perpendicular to the build also very rough. Only the component surface of the cuboid
direction. This results in part densities comparable to 1.00 – and the cylinder had a significantly smoother surface, as
1.06 g/cm³ (∥) and 1.03 – 1.05 g/cm³ (⊥). The micrograph the electron beam was able to fuse these areas together
very well without adhering loose powder particles.
analysis considers both open and closed pores and confirms
the gas pycnometer measurements in principle. This results in The size of pores in EBM components is usually <100 μm,
differences in density and porosity between the sections of the although these can also be significantly smaller than 50 μm
two build directions, which, however, do not show a uniform due to carefully selected process parameters. Gas pycnometry,
pattern and can therefore be attributed to the conditions in gravimetry, and micrograph analysis can detect these pores
the respective section plane under consideration (Figure 14). well. Similar to the powder-based SLS process, both open and
The component geometry may have an influence here, as the closed pores occur in EBM. The formation process is similar
femoral head in particular has a significantly lower density. to SLS and usually results from trapped gases, incomplete
However, the density values also differ significantly between melting of the powder, and unfavorable process settings.
the cutting directions, so the influence of the component The part densities and porosities of the individual EBM test
areas under consideration probably has a greater impact. components determined using the measurement methods
used are shown in Figure 16. The measurement accuracies of
4.1.3. EBM the three measurement methods are listed in Figure 8.
With EBM, all component designs could be produced The measured gas pycnometer density of the EBM
in one printing process (Figure 15A-C). The component test components of max. 0.01 g/cm³ or 0.23% is slightly
Volume 4 Issue 2 (2025) 16 doi: 10.36922/MSAM025090010