
Page 41 - MSAM-4-2
P. 41
Materials Science in Additive Manufacturing Measuring the porosity of AM components
Archimedes method. The deviations can be explained by the micrograph analysis, which leads to deviations. It should
fact that in the micrograph analysis the pores actually present, also be noted that the micrograph analysis only provides
including the closed pores, are included in the (true) density an insight into the microstructure of the components
determination. With the other two methods, the closed pores at the component plane under consideration and is not
are not included in the (apparent) density calculation. In representative of the entire component. For example, the
addition, subjective optical settings in the evaluation software area under consideration may have a higher density, but the
such as brightness, resolution, and visualization influence the rest of the component may have a lower density. A geometry
measurement results when determining the porosity of the dependency can also be recognized here, which is similar
to the Archimedes method. However, this does not serve
A B as proof of a geometry dependency, as the geometry is not
mapped here in the analysis of a 2D grinding plane.
4.1.2. SLS
Using SLS, all three component designs were successfully
manufactured in one printing process (Figure 12A-C). All
components are of good quality with no visible defects or
irregularities. The individual print layers are not or are only
very slightly recognizable. However, the component surface
is very rough. Sharp edges are less detailed and rounded
on all components, as the size of the individual powder
particles has a limiting effect on the sharpness of the edges.
The pore size in SLS-generated components depends on
the process parameters and material properties used but is
Figure 11. Micrographs and binary images for micrograph analyses of in the range of 1–50 μm for PA12 powder. Gas pycnometer
sintered FDM components made of 316L. (A) Section parallel to the build and the Archimedes buoyancy method are therefore
direction; (B) section perpendicular to the build direction. Scale bar: 500 μm very suitable for measuring pores in this size range, since
Abbreviation: FDM: Fused deposition modeling
micrograph analyses may not be able to capture smaller
pores well. In SLS-generated components, there are open
A B C and closed pores, with the latter filled with air, gases, or
even unfused powder. The density and porosity values
determined for the SLS components for all measurement
methods are listed in Figure 13 and the accuracies of the
respective measurement methods are displayed in Figure 8.
The density of the PA12 plastic components measured
by gas pycnometer is almost a true and reproducible density
Figure 12. Laser-sintered PA12 components. (A) Cuboid; (B) cylinder; for all test components. The helium molecules can easily
(C) femoral head penetrate the component through the smallest open pores
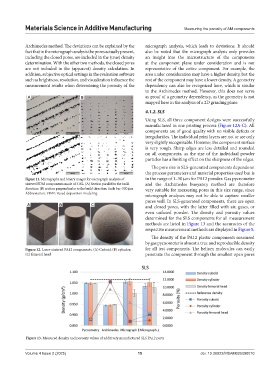
Figure 13. Measured density and porosity values of additively manufactured SLS PA12 parts
Volume 4 Issue 2 (2025) 15 doi: 10.36922/MSAM025090010