
Page 40 - MSAM-4-2
P. 40
Materials Science in Additive Manufacturing Measuring the porosity of AM components
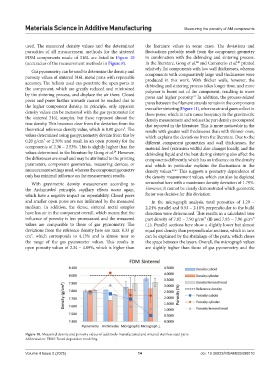
used. The measured density values and the determined the literature values in some cases. The deviations and
porosities of all measurement methods for the sintered fluctuations probably result from the component geometry
FDM components made of 316L are listed in Figure 10 in combination with the debinding and sintering process.
40
24
(accuracies of the measurement methods in Figure 8). In the literature, Gong et al. and Caminerio et al. printed
relatively flat components with low wall thicknesses, whereas
Gas pycnometry can be used to determine the density and
porosity values of sintered 316L metal parts with repeatable components with comparatively large wall thicknesses were
produced in this work. With thicker walls, however, the
accuracy. The helium used can penetrate the open pores in debinding and sintering process takes longer time, and more
the component, which are greatly reduced and minimized polymer is burnt out of the component, resulting in more
by the sintering process, and displace the air there. Closed pores and higher porosity. In addition, the process-related
31
pores and pores further inwards cannot be reached due to pores between the filament strands remain in the components
the higher component density. In principle, only apparent even after sintering (Figure 11), whereas air and gases collect in
density values can be measured with the gas pycnometer for these pores, which in turn cause buoyancy in the gravimetric
the sintered 316L samples, but these represent almost the density measurement and reduce the part density as compared
true density. This becomes clear from the deviation from the that reported in the literature. This is more noticeable in the
theoretical reference density value, which is 8.00 g/cm³. The results with greater wall thicknesses than with thinner ones,
values determined using gas pycnometry deviate from this by which explains the deviations from the literature. Due to the
0.20 g/cm³ or 2.50% and result in an open porosity for the different component geometries and wall thicknesses, the
components of 2.36 – 2.53%. This is slightly higher than the material feed (extrusion width) also changes locally, and the
24
values determined in the literature by Gong et al. However, debinding liquid and the heat during sintering also affect the
the differences are small and may be attributed to the printing components differently, which has an influence on the density
parameters, component geometries, measuring devices, or and which in particular explains the fluctuations in the
measurement settings used, whereas the component geometry density values. 41,42 This suggests a geometry dependence of
only has minimal influence on the measurement results. the density measurement values, which can also be depicted
With gravimetric density measurement according to somewhat here with a maximum density deviation of 1.79%.
the Archimedes’ principle, capillary effects occur again, However, it cannot be clearly demonstrated which geometric
which have a negative impact on repeatability. Closed pores factor was decisive for this deviation.
and smaller open pores are not infiltrated by the measured In the micrograph analysis, total porosities of 1.29 –
medium. In addition, the dense, sintered metal samples 2.24% parallel and 0.53 – 2.18% perpendicular to the build
have less air in the component overall, which means that the direction were determined. This results in a calculated true
influence of porosity is less pronounced and the measured part density of 7.82 – 7.90 g/cm³ (∥) and 7.83 – 7.96 g/cm³
values are comparable to those of gas pycnometry. The (⊥). Parallel sections here show a slightly lower but almost
deviations from the reference density here are max. 0.33 g/ equal part density than perpendicular sections, which in turn
cm³, which corresponds to 4.13% and is almost near to can be explained by the shrinkage of the parts, which closes
the range of the gas pycnometer values. This results in the space between the layers. Overall, the micrograph values
open porosity values of 2.34 – 4.09%, which is higher than are slightly higher than those of gas pycnometry and the
Figure 10. Measured density and porosity values of additively manufactured and sintered stainless steel parts
Abbreviation: FDM: Fused deposition modeling
Volume 4 Issue 2 (2025) 14 doi: 10.36922/MSAM025090010