
Page 132 - OR-1-2
P. 132
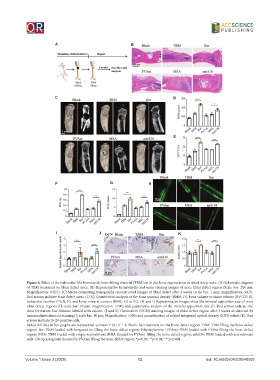
A                                B


                        C                                                  D


                                                                           E


                         F                      G               H


                         I                 J                                 K


            Figure 6. Effect of the trabeculae-like biomimetic bone-filling material (TBM) on in situ bone regeneration in tibial defect mice. (A) Schematic diagram
            of TBM treatment on tibial defect mice. (B) Representative hematoxylin and eosin staining images of mice tibial defect region (Scale bar: 200 μm;
            Magnification: ×32.5). (C) Micro-computing tomography reconstructed images of tibial defect after 3 weeks (scale bar: 1 mm; magnification: ×4.5).
            Red arrows indicate bone defect areas. (D-G) Quantitative analyzes of the bone mineral density (BMD; D), bone volume to tissue volume (BV/TV; E),
            trabecular number (Tb.N; F), and bone mineral content (BMC; G) in (C). (H and I) Representative images show the mineral apposition rate of mice
            tibial defect regions (H; scale bar: 10 μm; magnification: ×700) and quantitative analysis of the mineral apposition rate (I). Red arrows indicate the
            done formation line distance labeled with calcein. (J and K) Osteocalcin (OCN) staining images of tibial defect region after 3 weeks as detected by
            immunohistochemical staining (J; scale bar: 30 μm; Magnification: ×350) and quantification of related integrated optical density (IOD) values (K). Red
            arrows indicate OCN-positive cells.
            Notes: All data in bar graphs are represented as mean ± SD, n = 3; Blank: No treatment for the bone defect region; TBM: TBM filling the bone defect
            region; Ber: TBM loaded with bergamottin filling the bone defect region; Polyvinylamine (PVAm): TBM loaded with PVAm filling the bone defect
            region; MSA: TBM loaded with empty recombinant tRNA (loaded by PVAm) filling the bone defect region; anti138: TBM loaded with recombinant
            miR-138-5p antagonist (loaded by PVAm) filling the bone defect region; *p<0.05; **p<0.01; ***p<0.001.


            Volume 1 Issue 2 (2025)                         12                           doi: 10.36922/OR025040003