
Page 28 - TD-1-2
P. 28
Tumor Discovery Prognostic biomarkers in pancreatic cancer
A
B
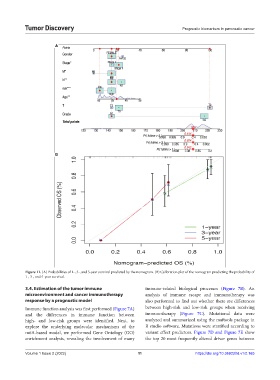
Figure 11. (A) Probabilities of 1-, 3-, and 5-year survival predicted by the nomogram. (B) Calibration plot of the nomogram predicting the probability of
1-, 3-, and 5-year survival.
3.4. Estimation of the tumor immune immune-related biological processes (Figure 7B). An
microenvironment and cancer immunotherapy analysis of immune escape and immunotherapy was
response by a prognostic model also performed to find out whether there are differences
Immune function analysis was first performed (Figure 7A) between high-risk and low-risk groups when receiving
and the differences in immune function between immunotherapy (Figure 7C). Mutational data were
high- and low-risk groups were identified. Next, to analyzed and summarized using the maftools package in
explore the underlying molecular mechanisms of the R studio software. Mutations were stratified according to
m6A-based model, we performed Gene Ontology (GO) variant effect predictors. Figure 7D and Figure 7E show
enrichment analysis, revealing the involvement of many the top 20 most frequently altered driver genes between
Volume 1 Issue 2 (2022) 11 https://doi.org/10.36922/td.v1i2.165