
Page 24 - TD-1-2
P. 24
Tumor Discovery Prognostic biomarkers in pancreatic cancer
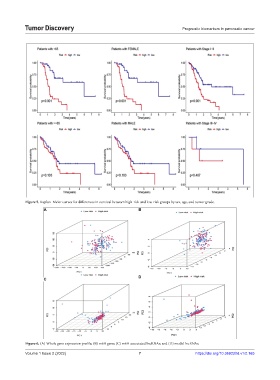
Figure 5. Kaplan–Meier curves for differences in survival between high-risk and low-risk groups by sex, age, and tumor grade.
A B
D
C
Figure 6. (A) Whole gene expression profile; (B) m6A gene; (C) m6A-associated lncRNAs; and (D) model lncRNAs.
Volume 1 Issue 2 (2022) 7 https://doi.org/10.36922/td.v1i2.165