
Page 23 - TD-1-2
P. 23
Tumor Discovery Prognostic biomarkers in pancreatic cancer
A D
E
B
C F
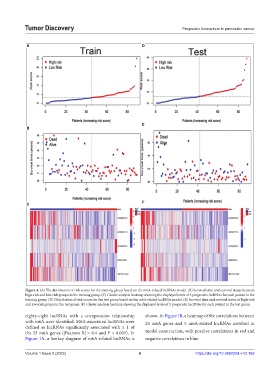
Figure 4. (A) The distribution of risk scores for the training group based on the m6A-related lncRNAs model. (B) Survival time and survival status between
high-risk and low-risk groups in the training group. (C) Cluster analysis heatmap showing the displayed levels of 5 prognostic lncRNAs for each patient in the
training group. (D) Distribution of risk scores for the test group based on the m6A-related lncRNAs model. (E) Survival time and survival status of high-risk
and low-risk groups in the test group. (F) Cluster analysis heatmap showing the displayed levels of 5 prognostic lncRNAs for each patient in the test group.
eighty-eight lncRNAs with a coexpression relationship shown. In Figure 1B, a heatmap of the correlations between
with m6A were identified. M6A-associated lncRNAs were 23 m6A genes and 5 m6A-related lncRNAs involved in
defined as lncRNAs significantly associated with ≥ 1 of
the 23 m6A genes (|Pearson R| > 0.4 and P < 0.001). In model construction, with positive correlations in red and
Figure 1A, a Sankey diagram of m6A-related lncRNAs is negative correlations in blue.
Volume 1 Issue 2 (2022) 6 https://doi.org/10.36922/td.v1i2.165