
Page 22 - TD-1-2
P. 22
Tumor Discovery Prognostic biomarkers in pancreatic cancer
A B
C D
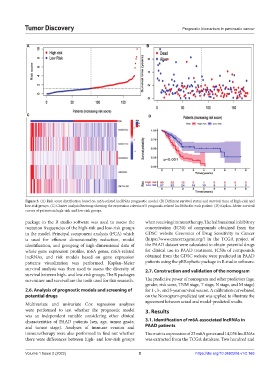
Figure 3. (A) Risk score distribution based on m6A-related lncRNAs prognostic model. (B) Different survival status and survival time of high-risk and
low-risk groups. (C) Cluster analysis heatmap showing the expression criteria of 5 prognosis-related lncRNAs for each patient. (D) Kaplan–Meier survival
curves of patients in high-risk and low-risk groups.
package in the R studio software was used to assess the when receiving immunotherapy. The half maximal inhibitory
mutation frequencies of the high-risk and low-risk groups concentration (IC50) of compounds obtained from the
in the model. Principal component analysis (PCA) which GDSC website Genomics of Drug Sensitivity in Cancer
is used for efficient dimensionality reduction, model (https://www.cancerrxgene.org/) in the TCGA project of
identification, and grouping of high-dimensional data of the PAAD dataset were calculated to obtain potential drugs
whole gene expression profiles, m6A genes, m6A-related for clinical use in PAAD treatment. IC50s of compounds
lncRNAs, and risk models based on gene expression obtained from the GDSC website were predicted in PAAD
patterns visualization was performed. Kaplan–Meier patients using the pRRophetic package in R studio software.
survival analysis was then used to assess the diversity of 2.7. Construction and validation of the nomogram
survival between high- and low-risk groups. The R packages
survminer and survival are the tools used for this research. The predictive power of nomogram and other predictors (age,
gender, risk score, TNM stage, T stage, N stage, and M stage)
2.6. Analysis of prognostic models and screening of for 1-, 3-, and 5-year survival was set. A calibration curve based
potential drugs on the Nomogram-predicted test was applied to illustrate the
agreement between actual and model-predicted results.
Multivariate and univariate Cox regression analyses
were performed to test whether the prognostic model 3. Results
was an independent variable considering other clinical
characteristics of PAAD patients (sex, age, tumor grade, 3.1. Identification of m6A-associated lncRNAs in
and tumor stage). Analyses of immune evasion and PAAD patients
immunotherapy were also performed to find out whether The matrix expression of 23 m6A genes and 14,056 lncRNAs
there were differences between high- and low-risk groups was extracted from the TCGA database. Two hundred and
Volume 1 Issue 2 (2022) 5 https://doi.org/10.36922/td.v1i2.165