
Page 20 - TD-1-2
P. 20
Tumor Discovery Prognostic biomarkers in pancreatic cancer
patients in TCGA, we screened the m6A-related lncRNAs high and low risk were constructed using the pheatmap
involved in model construction from 288 m6A-related package in R studio software. ROC curves were constructed
lncRNAs in the TCGA dataset (P < 0.05). This study used using the survival, survminer, and timeROC packages in R
univariate Cox regression and the Least Absolute Shrinkage studio software. Then, model validation was performed on
and Selection Operator (LASSO). Cox regression was clinical subgroups to find out which clinical subgroups our
performed using the R package glmnet to find m6A- model was applicable to.
related lncRNAs significantly associated with PAAD
patient survival in the TCGA dataset. Multivariate Cox 2.4. Differential gene identification, functional
regression was used to analyze m6A-related lncRNAs, and analysis, and tumor mutational burden
finally, a m6A-related lncRNAs risk model was established. Differentially expressed genes in high-risk and low-
The formula for calculating the risk score is as follows: risk groups were identified and Gene Ontology (GO)
functional analysis was performed on them. The filtering
Risk score = m6A-related lncRNAs1 × coef +
m6A-related lncRNAs2 × coef +… + m6A-related criteria of high-risk and low-risk differential genes were
logFCfilter > 1 and fdrFilter < 0.05. GO functional analysis
lncRNAsn×coef
was performed using the cluster profiler package in the R
Where coef represents the coefficient, which is the studio software. The analysis threshold was determined by
coefficient between lncRNAs and survival. Risk curves for p-value, with P < 0.05 indicating significant enrichment
A
B
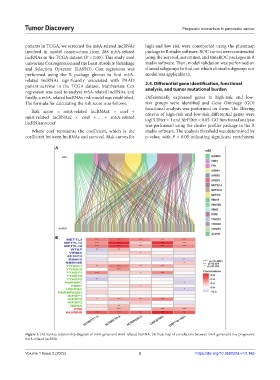
Figure 1. (A) Sankey relationship diagram of m6A genes and m6A-related lncRNA. (B) heat map of correlations between m6A genes and five prognostic
m6A-related lncRNA.
Volume 1 Issue 2 (2022) 3 https://doi.org/10.36922/td.v1i2.165