
Page 27 - TD-1-2
P. 27
Tumor Discovery Prognostic biomarkers in pancreatic cancer
A B
C D E
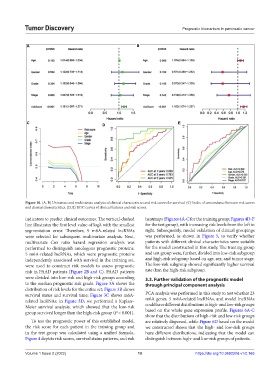
Figure 10. (A, B) Univariate and multivariate analysis of clinical characteristics and risk scores for survival. (C) Index of concordance between risk scores
and clinical characteristics. (D, E) ROC curves of clinical features and risk scores.
indicators to predict clinical outcomes. The vertical-dashed heatmaps (Figures 4A-C for the training group; Figures 4D-F
line illustrates the first level value of logλ with the smallest for the test group), with increasing risk levels from the left to
segmentation error. Therefore, 9 m6A-related lncRNAs right. Subsequently, model validation of clinical groupings
were selected for subsequent multivariate analysis. Next, was performed, as shown in Figure 5, to verify whether
multivariate Cox ratio hazard regression analysis was patients with different clinical characteristics were suitable
performed to distinguish autologous prognostic proteins. for the model constructed in this study. The training group
5 m6A-related lncRNAs, which were prognostic proteins and test group were, further, divided into low-risk subgroup
independently associated with survival in the training set, and high-risk subgroup based on age, sex, and tumor stage.
were used to construct risk models to assess prognostic The low-risk subgroup showed significantly higher survival
risk in PAAD patients (Figure 2B and C). PAAD patients rate than the high-risk subgroup.
were divided into low-risk and high-risk groups according 3.3. Further validation of the prognostic model
to the median prognostic risk grade. Figure 3A shows the through principal component analysis
distribution of risk levels for the entire set; Figure 3B shows
survival status and survival time; Figure 3C shows m6A- PCA analysis was performed in this study to test whether 23
related lncRNAs; in Figure 3D, we performed a Kaplan– m6A genes, 5 m6A-related lncRNAs, and model lncRNAs
Meier survival analysis, which showed that the low-risk could have different distributions in high- and low-risk groups
group survived longer than the high-risk group (P < 0.001). based on the whole gene expression profile. Figures 6A-C
show that the distributions of high-risk and low-risk groups
To test the prognostic power of this established model, are relatively dispersed, while Figure 6D based on the model
the risk score for each patient in the training group and we constructed shows that the high- and low-risk groups
in the test group was calculated using a unified formula. have different distributions, indicating that the model can
Figure 4 depicts risk scores, survival status patterns, and risk distinguish between high- and low-risk groups of patients.
Volume 1 Issue 2 (2022) 10 https://doi.org/10.36922/td.v1i2.165