
Page 32 - TD-2-1
P. 32
Tumor Discovery An approach for classification of lung nodules
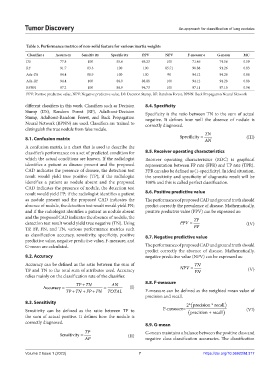
Table 5. Performance metrics of non‑solid feature for various inertia weights
Classifier s Accura cy Sensitiv ity Specific ity PPV NPV F‑measur e G‑mean MC
DS 77.8 100 55.6 69.23 100 71.46 74.56 0.59
RF 91.7 83.3 100 100 85.71 90.88 91.26 0.83
Ada-DS 94.4 88.9 100 100 90 94.12 94.28 0.88
Ada-RF 94.4 100 88.9 88.88 100 94.12 94.28 0.88
BPNN 97.2 100 88.9 94.73 100 97.11 97.15 0.94
PPV: Positive predictive value, NPV: Negative predictive value, DS: Decision Stump, RF: Random Forest, BPNN: Back Propagation Neural Network
different classifiers in this work. Classifiers such as Decision 8.4. Specificity
Stump (DS), Random Forest (RF), AdaBoost-Decision Specificity is the ratio between TN to the sum of actual
Stump, AdaBoost-Random Forest, and Back Propagation negative. It defines how well the absence of nodule is
Neural Network (BPNN) are used. Classifiers are trained to correctly diagnosed.
distinguish the true nodule from false nodule. TN
8.1. Confusion matrix Specificity = AN (III)
A confusion matrix is a chart that is used to describe the
classifier’s performance on a set of predicted condition for 8.5. Receiver operating characteristics
which the actual conditions are known. If the radiologist Receiver operating characteristics (ROC) is graphical
identifies a patient as disease present and the proposed representation between FP rate (FPR) and TP rate (TPR).
CAD indicates the presence of disease, the detection test FPR can also be defined as (1-specificity). In ideal situation,
result would yield true positive (TP); if the radiologist the sensitivity and specificity of diagnostic result will be
identifies a patient as nodule absent and the proposed 100% and this is called perfect classification.
CAD indicates the presence of nodule, the detection test
result would yield FP; if the radiologist identifies a patient 8.6. Positive predictive value
as nodule present and the proposed CAD indicates the The performance of proposed CAD and ground truth should
absence of nodule, the detection test result would yield FN; predict correctly the prevalence of disease. Mathematically,
and if the radiologist identifies a patient as nodule absent positive predictive value (PPV) can be expressed as:
and the proposed CAD indicates the absence of nodule, the TP
detection test result would yield true negative (TN). Using PPV = (IV)
TP, FP, FN, and TN, various performance metrics such PP
as classification accuracy, sensitivity, specificity, positive 8.7. Negative predictive value
predictive value, negative predictive value, F-measure, and
G-mean are calculated. The performance of proposed CAD and ground truth should
predict correctly the absence of disease. Mathematically,
8.2. Accuracy negative predictive value (NPV) can be expressed as:
Accuracy can be defined as the ratio between the sum of TN
TP and TN to the total sum of attributes used. Accuracy NPV = PN (V)
relies mainly on the classification rate of the classifier.
TP TN AN 8.8. F-measure
Accuracy (I)
TP TN FP FN TOTAL F-measure can be defined as the weighted mean value of
precision and recall.
8.3. Sensitivity 2* precision * recall
Sensitivity can be defined as the ratio between TP to F-measure= precision + recall (VI)
the sum of actual positive. It defines how the nodule is
correctly diagnosed.
8.9. G-mean
TP G-mean maintains a balance between the positive class and
Sensitivity = (II)
AP negative class classification accuracies. The classification
Volume 2 Issue 1 (2023) 7 https://doi.org/10.36922/td.317