
Page 60 - TD-2-1
P. 60
Tumor Discovery LCP2 regulates melanoma progression
A B C D E
F G I
J
K
M
L
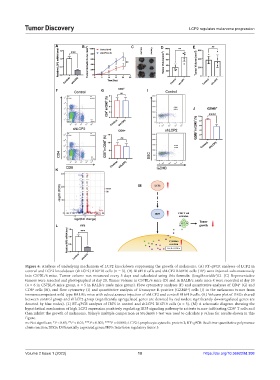
Figure 6. Analysis of underlying mechanism of LCP2 knockdown suppressing the growth of melanoma. (A) RT-qPCR analyses of LCP2 in
control and LCP2 knockdown (shLCP2) B16F10 cells (n = 3). (B) B16F10 cells and shLCP2 B16F10 cells (10 ) were injected subcutaneously
6
into C57BL/6 mice. Tumor volume was measured every 5 days and calculated using this formula: (length×width )/2. (C) Representative
2
tumors were resected and photographed at day 20. Tumor volume in C57BL/6 mice (D) and in BALB/c nude mice € were recorded at day 20
(n = 6 in C57BL/6 mice group, n = 5 in BALB/c nude mice group). Flow cytometry analyses (F) and quantitative analyses of CD4 (G) and
+
CD8 cells (H), and flow cytometry (I) and quantitative analysis of Granzyme B-positive (GZMB ) cells (J) in the melanoma tumor from
+
+
immunocompetent wild-type BALB/c mice with subcutaneous injection of shLCP2 and control B16F10 cells. (K) Volcano plot of DEGs shared
between control group and shLCP2 group (significantly upregulated genes are denoted by red nodes; significantly downregulated genes are
denoted by blue nodes). (L) RT-qPCR analyses of IRF5 in control and shLCP2 B16F10 cells (n = 3). (M) A schematic diagram showing the
hypothetical mechanism of high LCP2 expression positively regulating IRF5 signaling pathway to activate tumor-infiltrating CD8 T cells and
+
then inhibit the growth of melanoma. Tukey’s multiple comparison or Student’s t-test was used to calculate p values for results shown in this
figure.
ns: Not significan; *P < 0.05; **P < 0.01; ***P < 0.001; ****P < 0.0001; LCP2: Lymphocyte cytosolic protein 2; RT-qPCR: Real time-quantitative polymerase
chain reaction; DEGs: Differentially expressed genes; IRF5: Interferon regulatory factor 5.
Volume 2 Issue 1 (2023) 10 https://doi.org/10.36922/td.308