
Page 55 - TD-2-1
P. 55
Tumor Discovery LCP2 regulates melanoma progression
signaling pathways, T-cell receptor signaling pathway, Fc whether the prognostic value of the identified ten-gene
epsilon RI signaling pathway, and so on (Figure 1D). signature was independent of clinical characteristics, we
employed univariate and multivariate Cox regression
3.2. Identification of prognostic gene signature models to consider the covariates of age, sex, sample
Twelve out of 47 DEGs were statistically significant in type, tumor stage, Breslow thickness, and ulceration in
predicting the OS in univariate Cox proportional hazards TCGA data set. Since sex was not statistically significant
models in TCGA data set (Figure 2). Among them, in univariate Cox regression models for predicting both
BLNK, DAPP1 and IL18 were downregulated, and other OS and DFS, it was excluded when fitting multivariate
genes were upregulated in melanoma samples compared Cox regression models. Results showed that PIS was
to normal samples. These genes were then fitted in the statistically significant for predicting OS and DFS after
LASSO model, and ten of them that were predictive of adjusting for effects of several clinical information
OS were selected (Figure 3A). These genes include BLNK, (Figure 3C and D & Tables S2 and S3).
CD81, CLEC4E, CPPED1, IL18, ISG20, LCP2, MGRN1,
RAB5C, and TRIM32. Our results revealed that elevated 3.3. Construction and validation of PIS
expression of CD81, IL18, MGRN1, RAB5C, and TRIM32 The PIS was calculated based on the linear combination
were associated with worse OS for melanoma, and elevated of selected ten genes and corresponding coefficients, and
expression of BLNK, CLEC4E, CPPED1, ISG20, and LCP2 patients with melanoma in TCGA data set were divided into
were associated with better prognosis for melanoma. In high-risk group (N = 235) and low-risk group (N = 236).
addition, there were strong correlations among BLNK, The OS of high-risk group was significantly worse than that
IL18, CLEC4E, and LCP2 (Figure 3B). To investigate of low-risk group (log-rank P = 3e-10, HR: 2.343, 95% CI:
A B
C D
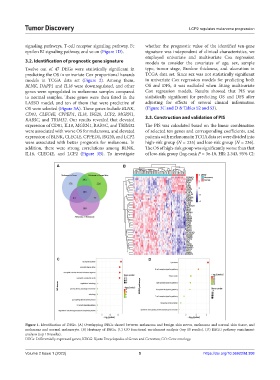
Figure 1. Identification of DEGs. (A) Overlapping DEGs shared between melanoma and benign skin nevus, melanoma and normal skin tissue, and
melanoma and normal melanocyte. (B) Heatmap of DEGs. (C) GO functional enrichment analysis (top 10 results). (D) KEGG pathway enrichment
analysis (top 10 results).
DEGs: Differentially expressed genes; KEGG: Kyoto Encyclopedia of Genes and Genomes; GO: Gene ontology.
Volume 2 Issue 1 (2023) 5 https://doi.org/10.36922/td.308