
Page 39 - TD-3-3
P. 39
Tumor Discovery LncRNA HA117 in osteosarcoma regulation
A B
C D
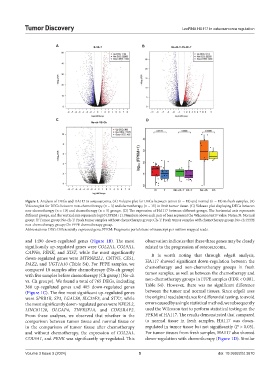
Figure 1. Analysis of DEGs and HA117 in osteosarcoma. (A) Volcano plot for DEGs between tumor (n = 18) and normal (n = 18) in fresh samples. (B)
Volcano plot for DEGs between non-chemotherapy (n = 3) and chemotherapy (n = 15) in fresh tumor tissue. (C) Volcano plot displaying DEGs between
non-chemotherapy (n = 10) and chemotherapy (n = 5) groups. (D) The expression of HA117 between different groups. The horizontal axis represents
different groups, and the vertical axis represents log10 (FPKM+1). Numbers above each pair of bars represent the Wilcoxon test P-value. Notes: N: Normal
group; T: Tumor group; No-ch-T: Fresh tumor samples without chemotherapy group; Ch-T: Fresh tumor samples with chemotherapy group; No-ch: FFPE
non-chemotherapy group; Ch: FFPE chemotherapy group.
Abbreviations: DEG: Differentially expressed gene; FPKM: Fragments per kilobase of transcript per million mapped reads.
and 1490 down-regulated genes (Figure 1B). The most observation indicates that these three genes may be closely
significantly up-regulated genes were COL2A1, COL9A1, related to the progression of osteosarcoma.
CAPN6, PENK, and XIST, while the most significantly It is worth noting that through edgeR analysis,
down-regulated genes were MTRNR2L1, CNTN5, CES1, HA117 showed significant down-regulation between the
DAZ2, and UGT1A10 (Table S4). For FFPE samples, we
compared 10 samples after chemotherapy (No-ch group) chemotherapy and non-chemotherapy groups in fresh
with five samples before chemotherapy (Ch group) (No-ch tumor samples, as well as between the chemotherapy and
vs. Ch groups). We found a total of 765 DEGs, including non-chemotherapy groups in FFPE samples (FDR < 0.001,
360 up-regulated genes and 405 down-regulated genes Table S4). However, there was no significant difference
(Figure 1C). The five most significant up-regulated genes between the tumor and normal tissues. Since edgeR uses
were SPRR1B, SP3, LGALS8, SLC35F3, and STX7, while the original read abundance for differential testing, to avoid
the most significantly down-regulated genes were NFE2L2, errors caused by a single statistical method, we subsequently
LINC01128, DLGAP4, TNFRSF1A, and CDK5RAP2. used the Wilcoxon test to perform statistical testing on the
From these analyses, we observed that whether in the FPKM of HA117. The results demonstrated that compared
comparison between tumor tissue and normal tissue or to normal tissue in fresh samples, HA117 was down-
in the comparison of tumor tissue after chemotherapy regulated in tumor tissue but not significantly (P > 0.05).
and without chemotherapy, the expression of COL2A1, For tumor tissues from fresh samples, HA117 also showed
COL9A1, and PENK was significantly up-regulated. This down-regulation with chemotherapy (Figure 1D). Similar
Volume 3 Issue 3 (2024) 5 doi: 10.36922/td.3670