
Page 43 - TD-3-3
P. 43
Tumor Discovery LncRNA HA117 in osteosarcoma regulation
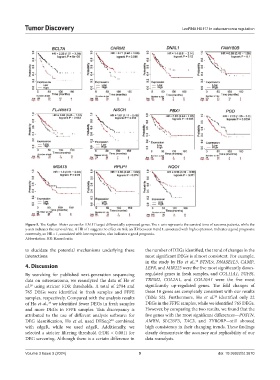
Figure 5. The Kaplan–Meier curves for HA117 target differentially expressed genes. The x-axis represents the survival time of sarcoma patients, while the
y-axis indicates the survival rate. A HR of 1 suggests no effect on risk; an HR between 0 and 1, associated with high expression, indicates a good prognosis;
conversely, an HR > 1, associated with low expression, also indicates a good prognosis.
Abbreviation: HR: Hazard ratio.
to elucidate the potential mechanisms underlying these the number of DEGs identified, the trend of changes in the
interactions. most significant DEGs is almost consistent. For example,
in the study by Ho et al., BTNL9, DNASE1L3, CAMP,
28
4. Discussion LEPR, and MIR223 were the five most significantly down-
By searching for published next-generation sequencing regulated genes in fresh samples, and COL11A1, TGFBI,
data on osteosarcoma, we reanalyzed the data of Ho et TREM2, COL2A1, and COL10A1 were the five most
28
al. using stricter FDR thresholds. A total of 2794 and significantly up-regulated genes. The fold changes of
765 DEGs were identified in fresh samples and FFPE these 10 genes are completely consistent with our results
samples, respectively. Compared with the analysis results (Table S2). Furthermore, Ho et al. identified only 22
28
of Ho et al., we identified fewer DEGs in fresh samples DEGs in the FFPE samples, while we identified 765 DEGs.
28
and more DEGs in FFPE samples. This discrepancy is However, by comparing the two results, we found that the
attributed to the use of different analysis software: for five genes with the most significant differences—POSTN,
DEG identification, Ho et al. used DESeq2 combined AMBN, SLC35F3, TAC3, and TYROBP—still showed
40
with edgeR, while we used edgeR. Additionally, we high consistency in their changing trends. These findings
selected a stricter filtering threshold (FDR < 0.001) for clearly demonstrate the accuracy and replicability of our
DEG screening. Although there is a certain difference in data reanalysis.
Volume 3 Issue 3 (2024) 9 doi: 10.36922/td.3670