
Page 62 - TD-3-3
P. 62
Tumor Discovery Pyroptosis-related genes in breast cancer progression
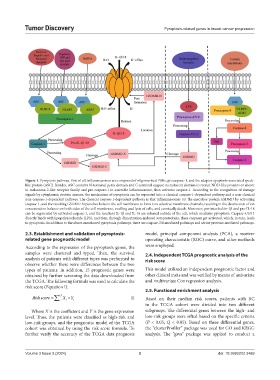
Figure 1. Pyroptosis pathway. First of all, inflammasomes are composed of oligomerized PRRs, procaspase-1, and the adaptor apoptosis-associated speck-
like protein (ASC). Besides, ASC contains N-terminal pyrin domain and C-terminal caspase recruitment domain to recruit NOD-like proteins or absent
in melanoma 2-like receptor family and pro-caspase-1 to assemble inflammasome, then activates caspase-1. According to the recognition of damage
signals by cytoplasmic protein sensors, the mechanism of pyroptosis can be separated into a classical caspase-1-dependent pathway and a non-classical
non-caspase-1-dependent pathway. The classical caspase-1-dependent pathway is that inflammasomes cut the executive protein GSDMD by activating
caspase-1, and the resulting GSDMD-N punches holes in the cell membrane to form non-selective membrane channels, resulting in the destruction of ion
concentration balance on both sides of the cell membrane, swelling and lysis of cells, and eventually death. Moreover, pro-interleukin-1β and pro-IL-18
can be segmented by activated caspase-1, and the resultant IL-1β and IL-18 are released outside of the cell, which mediates pyroptosis. Caspase-4/5/11
directly binds with lipopolysaccharide (LPS), and then, through dimerization-induced autoproteolysis, these caspases get activated, which, in turn, leads
to pyroptosis. In addition to the above-mentioned pyroptosis pathways, there are caspase-3/8-mediated pathways and serine protease-mediated pathways.
2.3. Establishment and validation of pyroptosis- model, principal component analysis (PCA), a receiver
related gene prognostic model operating characteristic (ROC) curve, and other methods
According to the expression of the pyroptosis genes, the were employed.
samples were clustered and typed. Then, the survival 2.4. Independent TCGA prognostic analysis of the
analysis of patients with different types was performed to risk score
observe whether there were differences between the two
types of patients. In addition, 15 prognostic genes were This model utilized an independent prognostic factor and
obtained by further screening the data downloaded from other clinical traits and was verified by means of univariate
the TCGA. The following formula was used to calculate the and multivariate Cox regression analysis.
risk score (Equation I):
2.5. Functional enrichment analysis
i ∑
Riskscore = 15 X × Y i I) Based on their median risk scores, patients with BC
i
in the TCGA cohort were divided into two different
Where X is the coefficient and Y is the gene expression subgroups. The differential genes between the high- and
level. Thus, the patients were classified as high-risk and low-risk groups were sifted based on the specific criteria
low-risk groups, and the prognostic model of the TCGA (P < 0.05; Q < 0.05). Based on these differential genes,
cohort was obtained by using the risk score formula. To the “clusterProfiler” package was used for GO and KEGG
further verify the accuracy of the TCGA data prognosis analysis. The “gsva” package was applied to conduct a
Volume 3 Issue 3 (2024) 3 doi: 10.36922/td.3469