
Page 67 - TD-3-3
P. 67
Tumor Discovery Pyroptosis-related genes in breast cancer progression
A B C
D E F
G H I
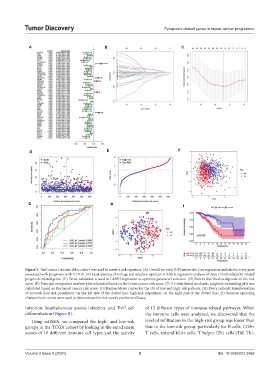
Figure 5. The Cancer Genome Atlas cohort was used to create a risk signature. (A) Overall survival (OS) univariate Cox regression analysis for every gene
associated with prognosis, with P < 0.01. (B) Least absolute shrinkage and selection operator (LASSO) regression analysis of these 15 individual OS-related
prognosis-related genes. (C) Cross-validation is used in LASSO regression to optimize parameter selection. (D) Patient distribution depends on the risk
score. (E) Principal component analysis plot calculated based on the breast cancer risk score. (F) A t-distributed stochastic neighbor embedding plot was
calculated based on the breast cancer risk score. (G) Kaplan-Meier curves for the OS of low and high-risk patients. (H) Every patient’s transformation
of survival (low-risk population: on the left side of the dotted line; high-risk population: on the right side of the dotted line). (I) Receiver operating
characteristic curves were used to demonstrate the risk score’s predictive efficacy.
infection, Staphylococcus aureus infection, and Th17 cell of 13 different types of immune-related pathways. When
differentiation (Figure 8). the immune cells were analyzed, we discovered that the
Using ssGSEA, we compared the high- and low-risk level of infiltration in the high-risk group was lower than
groups in the TCGA cohort by looking at the enrichment that in the low-risk group, particularly for B cells, CD8+
scores of 16 different immune cell types and the activity T cells, natural killer cells, T helper (Th) cells (Thf, Th1,
Volume 3 Issue 3 (2024) 8 doi: 10.36922/td.3469