
Page 64 - TD-3-3
P. 64
Tumor Discovery Pyroptosis-related genes in breast cancer progression
A
B C
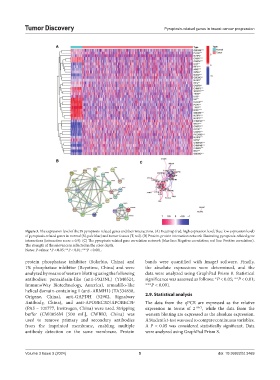
Figure 3. The expression level of the 39 pyroptosis-related genes and their interactions. (A) Heatmap (red: high expression level; blue: low expression level)
of pyroptosis-related genes in normal (N, pale blue) and tumor tissues (T, red). (B) Protein-protein interaction network illustrating pyroptosis-related gene
interactions (interaction score = 0.9). (C) The pyroptosis-related gene correlation network (blue line: Negative correlation; red line: Positive correlation).
The strength of the relevance is reflected in the color depth.
Notes: P-values: *P < 0.05; **P < 0.01; ***P < 0.001.
protein phosphatase inhibitor (Solarbio, China) and bands were quantified with ImageJ software. Finally,
1% phosphatase inhibitor (Beyotime, China) and were the absolute expressions were determined, and the
analyzed by means of western blotting using the following data were analyzed using GraphPad Prism 8. Statistical
antibodies: peroxidasin-like (anti-PXDNL) (YM0524, significance was assessed as follows: *P < 0.05; **P < 0.01;
ImmunoWay Biotechnology, America), armadillo-like ***P < 0.001.
helical domain-containing 1 (anti-ARMH1) (TA334858,
Origene, China), anti-GAPDH (52902, Signalway 2.9. Statistical analysis
Antibody, China), and anti-APOBEC3D/APOBEC3F The data from the qPCR are expressed as the relative
(PA5 – 101777, Invitrogen, China) were used. Stripping expression in terms of 2 -ΔΔCt , while the data from the
buffer (CW0056M [500 mL], CWBIO, China) was western blotting are expressed as the absolute expression.
used to remove primary and secondary antibodies A Student’s t-test was used to compare continuous variables.
from the imprinted membrane, enabling multiple A P < 0.05 was considered statistically significant. Data
antibody detection on the same membrane. Protein were analyzed using GraphPad Prism 8.
Volume 3 Issue 3 (2024) 5 doi: 10.36922/td.3469