
Page 65 - TD-3-3
P. 65
Tumor Discovery Pyroptosis-related genes in breast cancer progression
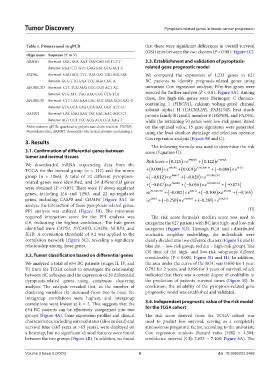
Table 1. Primers used in qPCR that there were significant differences in overall survival
(OS) times between the two clusters (P < 0.001; Figure 4C).
Oligo name Sequence (5’ to 3’)
ARMH1 Forward: GGC AGC AAT TAG CAG GCT CTT 3.3. Establishment and validation of pyroptosis-
Reverse: GAA CTT GTC GAG GAT GTG ACT C related gene prognostic model
PXDNL Forward: GAG ACC TTC TGA GAT TAG AGC GA We compared the expression of 1,231 genes in 627
Reverse: GCG TTG GAA TCC AGA CGC A BC patients to identify prognosis-related genes using
APOBEC3D Forward: CTT TCG AGG CCC GGT ACT AC univariate Cox regression analysis. Fifty-five genes were
Reverse: GTG ATC TGG AAG CGC CTG TTA selected for further analysis (P < 0.01; Figure 5A). Among
APOBEC3F Forward: CTT CAG AAA CAC AGT GGA GCG AAT G these, five high-risk genes were fibrinogen C domain-
containing 1 (FIBCD1), calcium voltage-gated channel
Reverse: GTA GCA CAG CCA GAC GGT ATT CC subunit alpha1 H (CACNA1H), FAM234B, heat shock
GAPDH Forward: CAT GAG AAG TAT GAC AAC AGC CT protein family B (small) member 8 (HSPB8), and PXDNL,
Reverse: AGT CCT TCC ACG ATA CCA AAG T while the remaining 50 genes were low-risk genes. Based
Abbreviations: qPCR: quantitative polymerase chain reaction. PXDNL: on the optimal value, 15 gene signatures were generated
Peroxidasin-like; ARMH1: Armadillo-like helical domain-containing 1. using the least absolute shrinkage and selection operator
Cox regression analysis (Figure 5B and C).
3. Results
The following formula was used to determine the risk
3.1. Confirmation of differential genes between score (Equation II):
tumor and normal tissues
)
Risk = Score ( 0.125 )× FIBCD 1 +e (0.122 e PXDNL
We downloaded mRNA sequencing data from the
)
(
TCGA for the normal group (n = 112) and the tumor ( + 0.099 )×e HSPE 8 + (0.019 e CACNA 1H +−0.008 )×e RGS 1
group (n = 1066). A total of 52 different pyroptosis- ( + − )×0.012 MMP 7 + (− e )×0.029 e APOBEC 3D
related genes were identified, and 39 differential genes PSME 2 +−0.058 APOBEC 3F +−0.073 )
(
(
were obtained (P < 0.05). There were 17 down-regulated ( + −0.047 )×e )×e
(
(
(
genes, including IL6 and TP63, and 22 up-regulated ×e KLHDC 7B +−0.082 )×e RAC 2 +−0.100 )×e MATK +−0.165 )
(
genes, including CASP8 and CHMP6 (Figure 3A). To ×e DEF 6 +−0.250 )×e APMH 1 +− ( 0.281) e DIRAS 3
×
analyze the interaction of these pyroptosis-related genes,
PPI analysis was utilized (Figure 3B). The minimum (II)
required interaction score for the PPI analysis was The risk score formula’s median score was used to
0.9, indicating the highest confidence. The hub genes categorize the 627 patients with BC into high- and low-risk
identified were CAPS1, PYCARD, CASP8, NLRP3, and categories (Figure 5D). Through PCA and t-distributed
IL1B. A correlation threshold of 0.2 was applied to the stochastic neighbor embedding, the individuals were
correlation network (Figure 3C), revealing a significant clearly divided into two different clusters (Figure 5E and F:
relationship among these genes. blue dot – low-risk group; red dot – high-risk group). The
OS time of the high- and low-risk subgroups differed
3.2. Tumor classification based on differential genes considerably (P < 0.001, Figure 5G and H). In addition,
We analyzed a total of 654 BC patients (stages II, IV, and the area under the curve of the ROC was 0.650 for 1 year,
V) from the TCGA cohort to investigate the relationship 0.792 for 2 years, and 0.696 for 3 years of survival, which
between BC subtypes and the expression of 39 differential indicated that there was a certain degree of credibility in
pyroptosis-related genes using consensus clustering the prediction of patients’ survival times (Figure 5I). In
analysis. The analysis revealed that, as the number of conclusion, the reliability of the pyroptosis-related gene
clustering variables (k) increased from two to nine, the prognostic model was established and validated.
intragroup correlations were highest, and intergroup
correlations were lowest at k = 2. This suggests that the 3.4. Independent prognostic value of the risk model
654 BC patients can be effectively categorized into two for the TCGA cohort
groups (Figure 4A). Gene expression profiles and clinical The risk score derived from the TCGA cohort was
characteristics, including survival status (alive or dead) and used to predict low survival, serving as a completely
survival time (≤65 years or >65 years), were displayed on autonomous prognostic factor, according to the univariate
a heatmap, but no significant clinical features were found Cox regression analysis (hazard ratio [HR] = 4.504;
between the two groups (Figure 4B). In addition, we found confidence interval [CI]: 2.855 − 7.108; Figure 6A). The
Volume 3 Issue 3 (2024) 6 doi: 10.36922/td.3469