
Page 93 - TD-3-3
P. 93
Tumor Discovery PTMAP5–hsa-miR-22-3p–KIF2C axis in HCC development
A D
B E
F
C
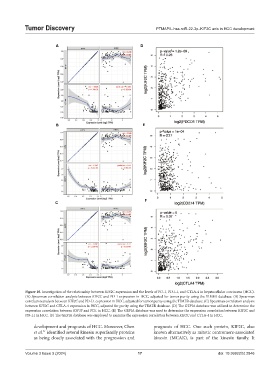
Figure 10. Investigation of the relationship between KIF2C expression and the levels of PD-1, PD-L1, and CTLA-4 in hepatocellular carcinoma (HCC).
(A) Spearman correlation analysis between KIF2C and PD-1 expression in HCC, adjusted for tumor purity using the TIMER database. (B) Spearman
correlation analysis between KIF2C and PD-L1 expression in HCC, adjusted for tumor purity using the TIMER database. (C) Spearman correlation analysis
between KIF2C and CTLA-4 expression in HCC, adjusted for purity using the TIMER database. (D) The GEPIA database was utilized to determine the
expression correlation between KIF3F and PD1 in HCC. (E) The GEPIA database was used to determine the expression correlation between KIF2C and
PD-L1 in HCC. (F) The GEPIA database was employed to examine the expression correlation between KIF2C and CTLA-4 in HCC.
development and prognosis of HCC. Moreover, Chen prognosis of HCC. One such protein, KIF2C, also
et al. identified several kinesin superfamily proteins known alternatively as mitotic centromere-associated
21
as being closely associated with the progression and kinesin (MCAK), is part of the kinesin family. It
Volume 3 Issue 3 (2024) 17 doi: 10.36922/td.2846