
Page 88 - TD-3-3
P. 88
Tumor Discovery PTMAP5–hsa-miR-22-3p–KIF2C axis in HCC development
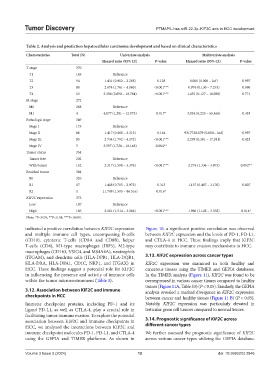
Table 2. Analysis and prediction hepatocellular carcinoma development and based on clinical characteristics
Characteristics Total (N) Univariate analysis Multivariate analysis
Hazard ratio (95% CI) P‑value Hazard ratio (95% CI) P‑value
T stage 370
T1 183 Reference
T2 94 1.431 (0.902 – 2.268) 0.128 0.000 (0.000 – Inf) 0.997
T3 80 2.674 (1.761 – 4.060) <0.001*** 0.974 (0.130 – 7.293) 0.980
T4 13 5.386 (2.690 – 10.784) <0.001*** 1.432 (0.127 – 16.098) 0.771
M stage 272
M0 268 Reference
M1 4 4.077 (1.281 – 12.973) 0.017* 3.834 (0.225 – 65.465) 0.353
Pathologic stage 349
Stage I 173 Reference
Stage II 86 1.417 (0.868 – 2.312) 0.164 9317720.879 (0.000 – Inf) 0.997
Stage III 85 2.734 (1.792 – 4.172) <0.001*** 2.299 (0.301 – 17.581) 0.423
Stage IV 5 5.597 (1.726 – 18.148) 0.004**
Tumor status 354
Tumor free 202 Reference
With tumor 152 2.317 (1.590 – 3.376) <0.001*** 2.274 (1.336 – 3.873) 0.002**
Residual tumor 344
R0 326 Reference
R1 17 1.448 (0.705 – 2.972) 0.313 1.137 (0.407 – 3.176) 0.807
R2 1 11.749 (1.595 – 86.516) 0.016*
KIF2C expression 373
Low 187 Reference
High 186 2.161 (1.514 – 3.084) <0.001*** 1.966 (1.148 – 3.368) 0.014*
Note: *P<0.05; **P<0.01; ***P<0.001.
indicated a positive correlation between KIF2C expression Figure 10, a significant positive correlation was observed
and multiple immune cell types, encompassing B-cells between KIF2C expression and the levels of PD-1, PD-L1,
(CD19), cytotoxic T-cells (CD8A and CD8B), helper and CTLA-4 in HCC. These findings imply that KIF2C
T-cells (CD4), M1-type macrophages (IRF5), M2-type may contribute to immune evasion mechanisms in HCC.
macrophages (CD163, VSIG4, and MS4A4A), neutrophils
(ITGAM), and dendritic cells (HLA-DPB1, HLA-DQB1, 3.13. KIF2C expression across cancer types
HLA-DRA, HLA-DPA1, CD1C, NRP1, and ITGAX) in KIF2C expression was examined in both healthy and
HCC. These findings suggest a potential role for KIF2C cancerous tissues using the TIMER and GEPIA databases.
in influencing the presence and activity of immune cells In the TIMER analysis (Figure 11), KIF2C was found to be
within the tumor microenvironment (Table 3). overexpressed in various cancer tissues compared to healthy
tissues (Figure 11A, Table S3) (P < 0.05). Similarly, the GEPIA
3.12. Association between KIF2C and immune analysis revealed a marked divergence in KIF2C expression
checkpoints in HCC between cancer and healthy tissues (Figure 11 B) (P < 0.05).
Immune checkpoint proteins, including PD-1 and its Notably, KIF2C expression was particularly elevated in
ligand PD-L1, as well as CTLA-4, play a crucial role in testicular germ cell tumors compared to normal tissues.
facilitating tumor immune evasion. To explore the potential
association between KIF2C and immune checkpoints in 3.14. Prognostic significance of KIF2C across
HCC, we analyzed the interactions between KIF2C and different cancer types
immune checkpoint molecules PD-1, PD-L1, and CTLA-4 We further assessed the prognostic significance of KIF2C
using the GEPIA and TIMER platforms. As shown in across various cancer types utilizing the GEPIA database.
Volume 3 Issue 3 (2024) 12 doi: 10.36922/td.2846