
Page 86 - TD-3-3
P. 86
Tumor Discovery PTMAP5–hsa-miR-22-3p–KIF2C axis in HCC development
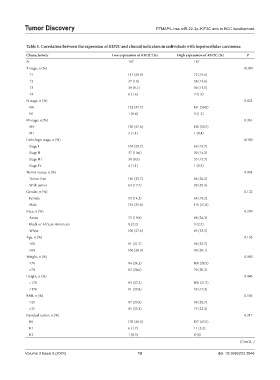
Table 1. Correlation between the expression of KIF2C and clinical indicators in individuals with hepatocellular carcinoma
Characteristic Low expression of KIF2C (%) High expression of KIF2C (%) P
N 187 187
T stage, n (%) <0.001
T1 111 (29.9) 72 (19.4)
T2 37 (10) 58 (15.6)
T3 30 (8.1) 50 (13.5)
T4 6 (1.6) 7 (1.9)
N stage, n (%) 0.623
N0 123 (47.7) 131 (50.8)
N1 1 (0.4) 3 (1.2)
M stage, n (%) 0.361
M0 130 (47.8) 138 (50.7)
M1 3 (1.1) 1 (0.4)
Pathologic stage, n (%) <0.001
Stage I 104 (29.7) 69 (19.7)
Stage II 37 (10.6) 50 (14.3)
Stage III 30 (8.6) 55 (15.7)
Stage IV 4 (1.1) 1 (0.3)
Tumor status, n (%) 0.003
Tumor free 116 (32.7) 86 (24.2)
With tumor 63 (17.7) 90 (25.4)
Gender, n (%) 0.122
Female 53 (14.2) 68 (18.2)
Male 134 (35.8) 119 (31.8)
Race, n (%) 0.239
Asian 72 (19.9) 88 (24.3)
Black or African American 8 (2.2) 9 (2.5)
White 100 (27.6) 85 (23.5)
Age, n (%) 0.133
≤60 81 (21.7) 96 (25.7)
>60 106 (28.4) 90 (24.1)
Weight, n (%) 0.050
≤70 84 (24.3) 100 (28.9)
>70 92 (26.6) 70 (20.2)
Height, n (%) 0.046
<170 93 (27.3) 108 (31.7)
≥170 81 (23.8) 59 (17.3)
BMI, n (%) 0.536
≤25 87 (25.8) 90 (26.7)
>25 85 (25.2) 75 (22.3)
Residual tumor, n (%) 0.217
R0 170 (49.3) 157 (45.5)
R1 6 (1.7) 11 (3.2)
R2 1 (0.3) 0 (0)
(Cont’d...)
Volume 3 Issue 3 (2024) 10 doi: 10.36922/td.2846