
Page 82 - TD-3-3
P. 82
Tumor Discovery PTMAP5–hsa-miR-22-3p–KIF2C axis in HCC development
A B C D E F
G H I J K L
M N O P Q R
S T U V W X
Y Z
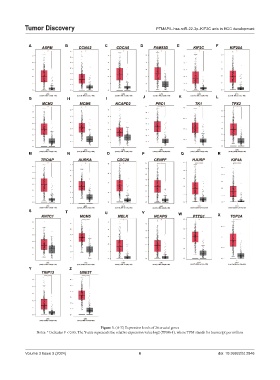
Figure 3. (A-Z) Expression levels of 26 crucial genes
Notes: * Indicates P < 0.05. The Y-axis represents the relative expression value log2 (TPM+1), where TPM stands for transcript per million
Volume 3 Issue 3 (2024) 6 doi: 10.36922/td.2846