
Page 80 - TD-3-3
P. 80
Tumor Discovery PTMAP5–hsa-miR-22-3p–KIF2C axis in HCC development
A B
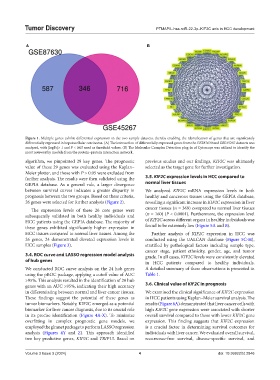
Figure 1. Multiple genes exhibit differential expression in the two sample datasets, thereby enabling the identification of genes that are significantly
differentially expressed in hepatocellular carcinoma. (A) The intersection of differentially expressed genes from the GSE87630 and GSE45267 datasets was
analyzed, with |logFc|> 1 and P < 0.05 used as threshold values. (B) The Molecular Complex Detection plug-in of Cytoscape was utilized to identify the
most noteworthy module from the protein–protein interaction network.
algorithm, we pinpointed 29 key genes. The prognostic previous studies and our findings, KIF2C was ultimately
value of these 29 genes was evaluated using the Kaplan– selected as the target gene for further investigation.
Meier plotter, and those with P > 0.05 were excluded from
further analysis. The results were then validated using the 3.5. KIF2C expression levels in HCC compared to
GEPIA database. As a general rule, a larger divergence normal liver tissues
between survival curves indicates a greater disparity in We analyzed KIF2C mRNA expression levels in both
prognosis between the two groups. Based on these criteria, healthy and cancerous tissues using the GEPIA database,
26 genes were selected for further analysis (Figure 2). revealing a significant increase in KIF2C expression in liver
The expression levels of these 26 core genes were cancer tissues (n = 369) compared to normal liver tissues
subsequently validated in both healthy individuals and (n = 160) (P < 0.0001). Furthermore, the expression level
HCC patients using the GEPIA database. The majority of of KIF2C across different organs in healthy individuals was
these genes exhibited significantly higher expression in found to be extremely low (Figure 5A and B).
HCC tissues compared to normal liver tissues. Among the Further analysis of KIF2C expression in HCC was
26 genes, 24 demonstrated elevated expression levels in conducted using the UALCAN database (Figure 5C-H),
HCC samples (Figure 3). stratified by pathological factors including sample type,
cancer stage, patient ethnicity, gender, age, and tumor
3.4. ROC curve and LASSO regression model analysis grade. In all cases, KIF2C levels were consistently elevated
of hub genes in HCC patients compared to healthy individuals.
We conducted ROC curve analysis on the 24 hub genes A detailed summary of these observations is presented in
using the pROC package, applying a cutoff value of AUC Table 1.
>95%. This analysis resulted in the identification of 20 hub
genes with an AUC >95%, indicating their high accuracy 3.6. Clinical value of KIF2C in prognosis
in differentiating between normal and liver cancer tissues. We examined the clinical significance of KIF2C expression
These findings suggest the potential of these genes as in HCC patients using Kaplan–Meier survival analysis. The
tumor biomarkers. Notably, KIF2C emerged as a potential results (Figure 6A) demonstrated that liver cancer cells with
biomarker for liver cancer diagnosis, due to its crucial role high KIF2C gene expression were associated with shorter
in its precise identification (Figure 4A-X). To minimize overall survival compared to those with lower KIF2C gene
overfitting in complex prognostic gene models, we expression. This finding suggests that KIF2C expression
employed the glmnet package to perform LASSO regression is a crucial factor in determining survival outcomes for
analysis (Figures 4Y and Z). This approach identified individuals with liver cancer. We evaluated overall survival,
two key predictive genes, KIF2C and TRIP13. Based on recurrence-free survival, disease-specific survival, and
Volume 3 Issue 3 (2024) 4 doi: 10.36922/td.2846