
Page 83 - TD-3-3
P. 83
Tumor Discovery PTMAP5–hsa-miR-22-3p–KIF2C axis in HCC development
A B C D E
F G H I J
K L M N O
P Q R S T
X
U V W
Y Z
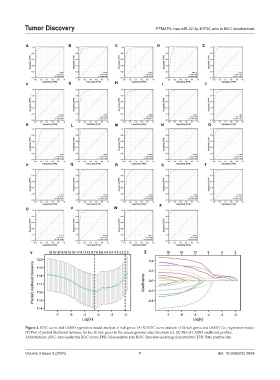
Figure 4. ROC curve and LASSO regression model analysis of hub genes. (A–X) ROC curve analysis of 24 hub genes and LASSO Cox regression model.
(Y) Plot of partial likelihood deviance for the 20 hub genes in the cancer genome atlas discovery set. (Z) Plot of LASSO coefficient profiles.
Abbreviations: AUC: Area under the ROC curve; FPR: False positive rate; ROC: Receiver operating characteristic; TPR: True positive rate.
Volume 3 Issue 3 (2024) 7 doi: 10.36922/td.2846