Page 87 - TD-3-3
P. 87

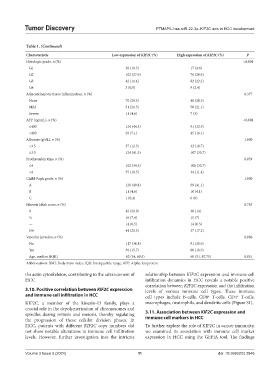
Tumor Discovery                                        PTMAP5–hsa-miR-22-3p–KIF2C axis in HCC development


            Table 1. (Continued)
            Characteristic                       Low expression of KIF2C (%)  High expression of KIF2C (%)  P
            Histologic grade, n (%)                                                                     <0.001
             G1                                                  38 (10.3)                  17 (4.6)
             G2                                                  102 (27.6)                  76 (20.6)
             G3                                                  42 (11.4)                  82 (22.2)
             G4                                                  3 (0.8)                    9 (2.4)
            Adjacent hepatic tissue inflammation, n (%)                                                  0.377
             None                                                70 (29.5)                  48 (20.3)
             Mild                                                51 (21.5)                  50 (21.1)
             Severe                                              11 (4.6)                   7 (3)
            AFP (ng/mL), n (%)                                                                          <0.001
             ≤400                                                124 (44.3)                  91 (32.5)
             >400                                                20 (7.1)                   45 (16.1)
            Albumin (g/dL), n (%)                                                                        1.000
             <3.5                                                37 (12.3)                  32 (10.7)
             ≥3.5                                                124 (41.3)                  107 (35.7)
            Prothrombin time, n (%)                                                                      0.059
             ≤4                                                  102 (34.3)                  106 (35.7)
             >4                                                  55 (18.5)                  34 (11.4)
            Child-Pugh grade, n (%)                                                                      1.000
             A                                                   120 (49.8)                  99 (41.1)
             B                                                   11 (4.6)                   10 (4.1)
             C                                                   1 (0.4)                    0 (0)
            Fibrosis Ishak score, n (%)                                                                  0.755
             0                                                   45 (20.9)                  30 (14)
             ½                                                   16 (7.4)                   15 (7)
             —                                                   14 (6.5)                   14 (6.5)
             5/6                                                 44 (20.5)                  37 (17.2)
            Vascular invasion, n (%)                                                                     0.086
             No                                                  117 (36.8)                  91 (28.6)
             Yes                                                 50 (15.7)                  60 (18.9)
             Age, median (IQR)                         63 (54, 69.5)              60 (51, 67.75)         0.051
            Abbreviations: BMI: Body mass index; IQR: Interquartile range; AFP: Alpha-fetoprotein.

            the actin cytoskeleton, contributing to the advancement of   relationship between KIF2C expression and immune cell
            HCC.                                               infiltration dynamics in HCC reveals a notable positive
                                                               correlation between KIF2C expression and the infiltration
            3.10. Positive correlation between KIF2C expression   levels of various immune cell types. These immune
            and immune cell infiltration in HCC                cell types include B-cells, CD8  T-cells, CD4  T-cells,
                                                                                         +
                                                                                                      +
            KIF2C, a member of the kinesin-13 family, plays a   macrophages, neutrophils, and dendritic cells (Figure S1).
            crucial role in the depolymerization of chromosomes and
            spindles during mitosis and meiosis, thereby regulating   3.11. Association between KIF2C expression and
            the progression of these cellular division phases. In   immune cell markers in HCC
            HCC, patients with different  KIF2C copy numbers did   To further explore the role of KIF2C in cancer immunity,
            not show notable alterations in immune cell infiltration   we examined its association with immune cell marker
            levels. However, further investigation into the intricate   expression in HCC using the GEPIA tool. The findings


            Volume 3 Issue 3 (2024)                         11                                doi: 10.36922/td.2846
   82   83   84   85   86   87   88   89   90   91   92