
Page 91 - TD-3-3
P. 91
Tumor Discovery PTMAP5–hsa-miR-22-3p–KIF2C axis in HCC development
A B C D E
F G H I
J
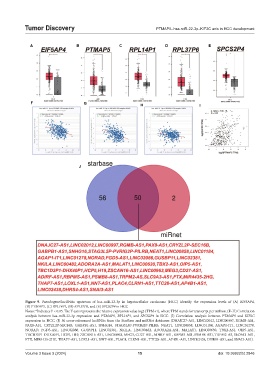
Figure 9. Pseudogene/lncRNAs upstream of hsa-miR-22-3p in hepatocellular carcinoma (HCC) identify the expression levels of (A) EIF5AP4,
(B) PTMAP5, (C) RPL14P1, (D) RPL37P6, and (E) SPCS2P4 in HCC
Notes: *Indicates P < 0.05. The Y-axis represents the relative expression value log2 (TPM+1), where TPM stands for transcript per million. (F–H) Correlation
analysis between hsa-miR-22-3p expression and PTMAP5, RPL14P1, and SPCS2P4 in HCC. (I) Correlation analysis between PTMAP5 and KIF2C
expression in HCC. (J) 50 cross-referenced lncRNAs from the StarBase and miRNet databases (DNAJC27-AS1, LINC02012, LINC00997, RGMB-AS1,
PAX8-AS1, CRYZL2P-SEC16B, GABPB1-AS1, SNHG16, STAG3L5P-PVRIG2P-PILRB, NEAT1, LINC00858, LINC01184, AGAP1-IT1, LINC01278,
NORAD, FGD5-AS1, LINC02086, GUSBP11, LINC02381, NKILA, LINC00482, ADORA2A-AS1, MALAT1, LINC00630, TBX2-AS1, OIP5-AS1,
TBC1D3P1-DHX40P1, HCP5, H19, ZSCAN16-AS1, LINC00963, MEG3, CD27-AS1, ADIRF-AS1, RBPMS-AS1, PSMB8-AS1, TRPM2-AS, SLC9A3-AS1,
FTX, MIR4435-2HG, THAP7-AS1, LOXL1-AS1, NNT-AS1, PLAC4, CLRN1-AS1, TTC28-AS1, AP4B1-AS1, LINC02438, DHRS4-AS1, and SNAI3-AS1).
Volume 3 Issue 3 (2024) 15 doi: 10.36922/td.2846