
Page 90 - TD-3-3
P. 90
Tumor Discovery PTMAP5–hsa-miR-22-3p–KIF2C axis in HCC development
A B C D E
F G H I J
K L M N O
P Q R S T
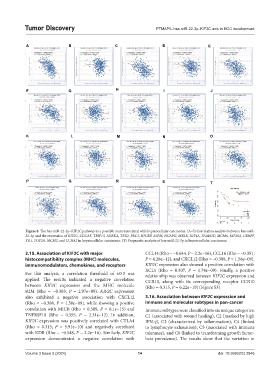
Figure 8. The has-miR-22-3p–KIF2C pathway as a possible route associated with hepatocellular carcinoma. (A–S) Correlation analysis between hsa-miR-
22-3p and the expression of KIF2C, CDCA5, TRIP13, AURKA, TPX2, PRC1, HJURP, ASPM, NCAPG, MELK, KIF4A, FAM83D, MCM6, KIF20A, CENPF,
TK1, TOP2A, MCM2, and CCNA2 in hepatocellular carcinoma. (T) Prognostic analysis of has-miR-22-3p in hepatocellular carcinoma.
3.15. Association of KIF2C with major CCL14 (Rho = −0.644, P = 2.2e−16), CCL16 (Rho = −0.351,
histocompatibility complex (MHC) molecules, P = 4.28e−12), and CXCL12 (Rho = −0.308, P = 1.58e−09).
immunomodulators, chemokines, and receptors KIF2C expression also showed a positive correlation with
XCL1 (Rho = 0.307, P = 1.74e−09). Finally, a positive
For this analysis, a correlation threshold of ±0.3 was relationship was observed between KIF2C expression and
applied. The results indicated a negative correlation CCR10, along with its corresponding receptor CCR10
between KIF2C expression and the MHC molecule (Rho = 0.315, P = 6.22e−10) (Figure S3).
B2M (Rho = −0.303, P = 2.97e−09). KIF2C expression
also exhibited a negative association with CXCL12 3.16. Association between KIF2C expression and
(Rho = −0.308, P = 1.58e−09), while showing a positive immune and molecular subtypes in pan-cancer
correlation with MICB (Rho = 0.389, P = 6.1e−15) and Immune subtypes were classified into six unique categories:
TNFRSF18 (Rho = 0.355, P = 2.31e−12). In addition, C1 (associated with wound healing), C2 (marked by high
KIF2C expression was positively correlated with CTLA4 IFN-γ), C3 (characterized by inflammation), C4 (linked
(Rho = 0.315, P = 5.91e−10) and negatively correlated to lymphocyte exhaustion), C5 (associated with immune
with KDR (Rho = −0.548, P = 2.2e−16). Similarly, KIF2C tolerance), and C6 (linked to transforming growth factor-
expression demonstrated a negative correlation with beta prevalence). The results show that the variation in
Volume 3 Issue 3 (2024) 14 doi: 10.36922/td.2846