
Page 85 - TD-3-3
P. 85
Tumor Discovery PTMAP5–hsa-miR-22-3p–KIF2C axis in HCC development
A
B C D
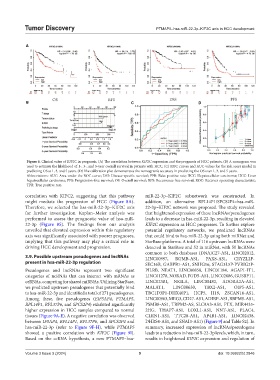
Figure 6. Clinical value of KIF2C in prognosis. (A) The correlation between KIF2C expression and the prognosis of HCC patients. (B) A nomogram was
used to estimate the likelihood of 1-, 3-, and 5-year overall survival in patients with HCC. (C) ROC curves and AUC values for the risk score model in
predicting OS at 1, 3, and 5 years. (D) The calibration plot demonstrates the nomogram’s accuracy in predicting the OS over 1, 3, and 5 years.
Abbreviations: AUC: Area under the ROC curve; DSS: Disease-specific survival; FPR: False positive rate; HCC: Hepatocellular carcinoma; HCC: Liver
hepatocellular carcinoma; PFS: Progression-free survival; OS: Overall survival; RFS: Recurrence-free survival; ROC: Receiver operating characteristic;
TPR: True positive rate.
correlation with KIFC2, suggesting that this pathway miR-22-3p–KIF2C subnetwork was constructed. In
might mediate the progression of HCC (Figure 8A). addition, an alternative RPL14P1/SPCS2P4–hsa-miR-
Therefore, we selected the hsa-miR-22-3p–KIF2C axis 22-3p–KIF2C network was proposed. The study revealed
for further investigation. Kaplan–Meier analysis was that heightened expression of these lncRNAs/pseudogenes
performed to assess the prognostic value of hsa-miR- leads to a decrease in hsa-miR-22-3p, resulting in elevated
22-3p (Figure 8S). The findings from our analysis KIF2C expression as HCC progresses. To further explore
unveiled that elevated expression within this regulatory potential regulatory networks, we predicted lncRNAs
axis was significantly associated with poorer prognoses, that could bind to hsa-miR-22-3p using both miRNet and
implying that this pathway may play a critical role in StarBase platforms. A total of 116 upstream lncRNAs were
driving HCC development and progression. detected in StarBase and 52 in miRNet, with 50 lncRNAs
common to both databases (DNAJC27-AS1, LINC02012,
3.9. Possible upstream pseudogenes and lncRNAs LINC00997, RGMB-AS1, PAX8-AS1, CRYZL2P-
present in hsa-miR-22-3p regulation SEC16B, GABPB1-AS1, SNHG16, STAG3L5P-PVRIG2P-
Pseudogenes and lncRNAs represent two significant PILRB, NEAT1, LINC00858, LINC01184, AGAP1-IT1,
categories of ncRNAs that can interact with mRNAs as LINC01278, NORAD, FGD5-AS1, LINC02086, GUSBP11,
ceRNAs, competing for shared miRNAs. Utilizing StarBase, LINC02381, NKILA, LINC00482, ADORA2A-AS1,
we predicted upstream pseudogenes that potentially bind MALAT1, LINC00630, TBX2-AS1, OIP5-AS1,
to hsa-miR-22-3p and identified a total of 271 pseudogenes. TBC1D3P1-DHX40P1, HCP5, H19, ZSCAN16-AS1,
Among these, five pseudogenes (EIF5AP4, PTMAP5, LINC00963, MEG3, CD27-AS1, ADIRF-AS1, RBPMS-AS1,
RPL14P1, RPL37P6, and SPCS2P4) exhibited significantly PSMB8-AS1, TRPM2-AS, SLC9A3-AS1, FTX, MIR4435-
higher expression in HCC samples compared to normal 2HG, THAP7-AS1, LOXL1-AS1, NNT-AS1, PLAC4,
tissues (Figure 9A-E). A negative correlation was observed CLRN1-AS1, TTC28-AS1, AP4B1-AS1, LINC02438,
between IF5AP4, RPL14P1, RPL37P6, and SPCS2P4 and DHRS4-AS1, and SNAI3-AS1) (Figure 9J and Table S2). In
hsa-miR-22-3p (refer to Figure 9F-H), while PTMAP5 summary, increased expression of lncRNAs/pseudogene
showed a positive correlation with KIF2C (Figure 9I). leads to a reduction in hsa-miR-22-3p levels, which, in turn,
Based on the ceRNA hypothesis, a new PTMAP5–hsa- results in heightened KIF2C expression and regulation of
Volume 3 Issue 3 (2024) 9 doi: 10.36922/td.2846