
Page 81 - TD-3-3
P. 81
Tumor Discovery PTMAP5–hsa-miR-22-3p–KIF2C axis in HCC development
A B C D E F
G H I J K L
M N O P Q R
S T U V W X
Y Z
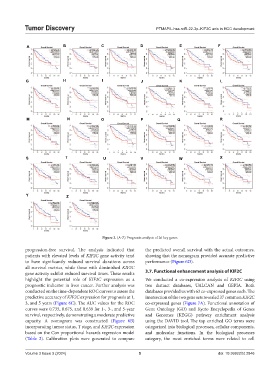
Figure 2. (A-Z) Prognosis analysis of 26 key genes
progression-free survival. The analysis indicated that the predicted overall survival with the actual outcomes,
patients with elevated levels of KIF2C gene activity tend showing that the nomogram provided accurate predictive
to have significantly reduced survival durations across performance (Figure 6D).
all survival metrics, while those with diminished KIF2C
gene activity exhibit reduced survival times. These results 3.7. Functional enhancement analysis of KIF2C
highlight the potential role of KIF2C expression as a We conducted a co-expression analysis of KIF2C using
prognostic indicator in liver cancer. Further analysis was two distinct databases, UALCAN and GEPIA. Both
conducted on the time-dependent ROC curves to assess the databases provided us with 63 co-expressed genes each. The
predictive accuracy of KIF2C expression for prognosis at 1, intersection of the two gene sets revealed 37 common KIF2C
3, and 5 years (Figure 6C). The AUC values for the ROC co-expressed genes (Figure 7A). Functional annotation of
curves were 0.735, 0.675, and 0.639 for 1-, 3-, and 5-year Gene Ontology (GO) and Kyoto Encyclopedia of Genes
survival, respectively, demonstrating a moderate predictive and Genomes (KEGG) pathway enrichment analysis
capacity. A nomogram was constructed (Figure 6B) using the DAVID tool. The top enriched GO terms were
incorporating tumor status, T stage, and KIF2C expression categorized into biological processes, cellular components,
based on the Cox proportional hazards regression model and molecular functions. In the biological processes
(Table 2). Calibration plots were generated to compare category, the most enriched terms were related to cell
Volume 3 Issue 3 (2024) 5 doi: 10.36922/td.2846