
Page 114 - TD-3-4
P. 114
Tumor Discovery Bioinformatics insights into CCL2 mutations
A B
C D
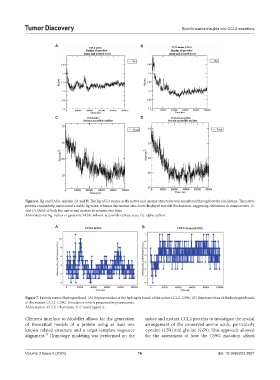
Figure 6. Rg and SASA analysis. (A and B) The Rg of Cα atoms in the native and mutant structures was monitored throughout the simulation. The native
protein consistently maintained a stable Rg value, whereas the mutant structures displayed notable fluctuations, suggesting alterations in compactness. (C
and D) SASA of both the native and mutant structures over time
Abbreviations: Rg: radius of gyration; SASA: solvent-accessible surface area; Cα: alpha carbon.
A B
Figure 7. Protein contact hydrogen bond. (A) Representation of the hydrogen bonds of the native CCL2–C59C. (B) Representation of the hydrogen bonds
of the mutant CCL2–C59G. Simulation time is presented in picoseconds.
Abbreviation: CCL2: Chemokine C-C motif ligand 2.
Chimera interface to Modeller allows for the generation native and mutant CCL2 proteins to investigate the spatial
of theoretical models of a protein using at least one arrangement of the conserved amino acids, particularly
known related structure and a target-template sequence cysteine (C59) and glycine (G59). This approach allowed
alignment. Homology modeling was performed on the for the assessment of how the C59G mutation affects
77
Volume 3 Issue 4 (2024) 16 doi: 10.36922/td.3891