
Page 158 - TD-3-4
P. 158
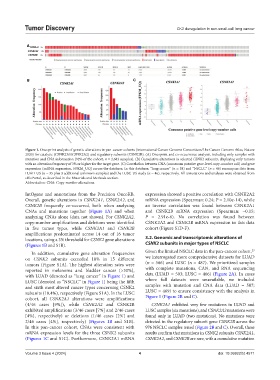
Tumor Discovery                                                 CK2 deregulation in non-small-cell lung cancer


            A


            B                                             C


            Figure 1. Oncoprint analysis of genetic alterations in pan-cancer cohorts (International Cancer Genome Consortium/The Cancer Genome Atlas, Nature
            2020) for catalytic (CSNK2A1/CSNK2A2) and regulatory subunits (CSNK2B). (A) Oncoprint and co-occurrence analysis, including only samples with
            mutation and CNA information (92% of the cohort, n = 2,683 samples). (B) Cumulative alterations in selected CSNK2 subunits, displaying only tumors
            with an alteration frequency of 3% or higher for the target gene. (C) Correlation between CNA (consensus putative gene-level copy-number call) and gene
            expression (mRNA expression, FPKM_UQ) across the database. In this database, “lung cancer” (n = 38) and “NSCLC” (n = 46) encompass data from
            LUAD-US (n = 35 plus 3 additional unknown samples) and the LUSC-US study (n = 46), respectively. All annotations and analyses were obtained from
            cBioPortal, as described in the Materials and Methods section.
            Abbreviation: CNA: Copy-number alterations.

            IntOgene  and  annotations  from  the  Precision  OncoKB.   expression showed a positive correlation with CSNK2A2
            Overall, genetic alterations in CSNK2A1, CSNK2A2, and   mRNA expression (Spearman: 0.24; P = 2.10e-14), while
            CSNK2B frequently co-occurred, both when analyzing   an inverse correlation was found between CSNK2A1
            CNAs and mutations together (Figure  1A) and when   and CSNK2B mRNA expression (Spearman: −0.15;
            analyzing CNAs alone (data not shown). For CSNK2A2,   P  =  2.91e-6).  No  correlation  was  found  between
            copy-number amplifications and deletions were identified   CSNK2A2 and CSNK2B mRNA expression in this data
            in five tumor types, while  CSNK2A1 and  CSNK2B    cohort (Figure S1D-F).
            amplifications predominated across 14 out of 16 tumor
            locations, using a 3% threshold for CSNK2 gene alterations   3.2. Genomic and transcriptomic alterations of
            (Figures 1B and S1B).                              CSNK2 subunits in major types of NSCLC
                                                                                                            23
              In addition, cumulative gene alteration frequencies   Given the limited NSCLC data in the pan-cancer cohort,
            on  CSNK2 subunits exceeded 10% in 15 different    we interrogated more comprehensive datasets for LUAD
            tumors (Figure S1A). The highest alteration rates were   (n = 566) and LUSC (n = 487). We prioritized samples
            reported in melanoma and bladder cancer (>30%),    with complete mutations, CAN, and RNA sequencing
            with LUAD (denoted as “lung cancer” in Figure 1) and   data (LUAD = 503; LUSC = 466) (Figure 2A). In cases
            LUSC (denoted as “NSCLC” in Figure 1) being the fifth   where full datasets were unavailable, we included
            and sixth most altered cancer types concerning CSNK2   samples with mutation and CNA data (LUAD = 507;
            subunits (18.4%), respectively (Figure S1A). In the LUSC   LUSC = 469) to ensure consistency with the analysis in
            cohort, all  CSNK2A1 alterations were amplifications   Figure 1 (Figure 2B and C).
            (4/46  cases [9%]), while  CSNK2A2 and CSNK2B        CSNK2A1 exhibited very few mutations in LUAD and
            exhibited amplifications (3/46 cases [7%] and 2/46 cases   LUSC samples (six mutations), and CSNK2A2 mutations were
            [4%], respectively) or deletions (1/46  cases [2%] and   found only in LUAD (two mutations). No mutations were
            2/46  cases  [4%],  respectively)  (Figures  1B  and  S1B).   detected in the regulatory subunit gene CSNK2B across the
            In this pan-cancer cohort, CNAs were consistent with   976 NSCLC samples tested (Figure 2B and C). Overall, these
            mRNA expression levels for the three CSNK2 subunits   results confirm that mutations in CSNK2 subunits CSNK2A1,
            (Figures 1C and S1C). Furthermore, CSNK2A1 mRNA    CSNK2A2, and CSNK2B are rare, with a cumulative mutation


            Volume 3 Issue 4 (2024)                         4                                 doi: 10.36922/td.4571