
Page 161 - TD-3-4
P. 161
Tumor Discovery CK2 deregulation in non-small-cell lung cancer
A B
C D
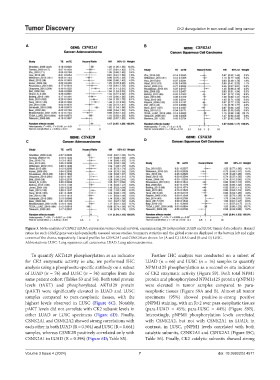
Figure 3. Meta-analysis of CSNK2 mRNA expression versus overall survival, encompassing 20 independent LUAD and LUSC tumor data cohorts. Hazard
ratios for each CSNK2 gene were independently assessed across studies. Summary statistics and the global score are displayed at the bottom left and right
corners of the charts, respectively. Hazard profiles for CSNK2A1 and CSNK2B are shown for (A and C) LUAD and (B and D) LUSC.
Abbreviations: LUSC: Lung squamous cell carcinoma; LUAD: Lung adenocarcinoma.
To quantify AKTs129 phosphorylation as an indicator Further IHC analysis was conducted on a subset of
for CK2 enzymatic activity in situ, we performed IHC LUAD (n = 66) and LUSC (n = 16) samples to quantify
analysis using a phosphosite-specific antibody on a subset NPM1s125 phosphorylation as a second in situ indicator
of LUAD (n = 76) and LUSC (n = 36) samples from the of CK2 enzymatic activity (Figure S9). Both total NPM1
same patient cohort (Tables S3 and S4). Both total protein protein and phosphorylated NPM1s125 protein (pNPM1)
levels (tAKT) and phosphorylated AKTs129 protein were elevated in tumor samples compared to para-
(pAKT) were significantly elevated in LUAD and LUSC neoplastic tissues (Figure S9A and B). Almost all tumor
samples compared to para-neoplastic tissues, with the specimens (95%) showed positive-to-strong positive
highest levels observed in LUSC (Figure 6C). Notably, pNPM1 staining, with an R>2 over para-neoplastic tissues
pAKT levels did not correlate with CK2 subunit levels in (para-LUAD = 45%; para-LUSC = 44%) (Figure S9B).
either LUAD or LUSC specimens (Figure 6D). Finally, Interestingly, pNPM1 phosphorylation levels correlated
CSNK2A1 and CSNK2A2 showed strong correlations with with CSNK2A2, but not with CSNK2A1 in LUAD; in
each other in both LUAD (R = 0.504) and LUSC (R = 0.661) contrast, in LUSC, pNPM1 levels correlated with both
samples, whereas CSNK2B positively correlated only with catalytic subunits, CSNK2A1 and CSNK2A2 (Figure S9C;
CSNK2A1 in LUAD (R = 0.398) (Figure 6D; Table S5). Table S6). Finally, CK2 catalytic subunits showed strong
Volume 3 Issue 4 (2024) 7 doi: 10.36922/td.4571