
Page 159 - TD-3-4
P. 159
Tumor Discovery CK2 deregulation in non-small-cell lung cancer
A
B C
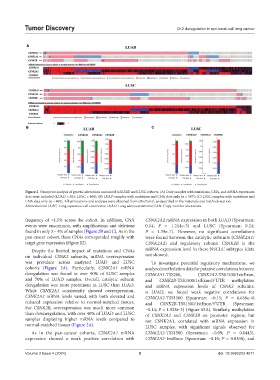
Figure 2. Oncoprint analysis of genetic alterations contained in LUAD and LUSC cohorts. (A) Only samples with mutations, CNA, and mRNA expression
data were included (LUAD = 503; LUSC = 466); (B) LUAD samples with mutations and CNA data only (n = 507); (C) LUSC samples with mutations and
CNA data only (n = 469). All annotations and analyses were obtained from cBioPortal, as described in the materials and methods section.
Abbreviations: LUSC: Lung squamous cell carcinoma; LUAD: Lung adenocarcinoma; CAN: Copy-number alterations.
frequency of <1.5% across the cohort. In addition, CNA CSNK2A2 mRNA expression in both LUAD (Spearman:
events were uncommon, with amplifications and deletions 0.14; P = 1.214e-3) and LUSC (Spearman: 0.24;
found in only 3 – 4% of samples (Figure 2B and C). As in the P = 1.39e-7). However, no significant correlations
pan-cancer cohort, these CNAs corresponded roughly with were found between the catalytic subunits (CSNK2A1/
target gene expression (Figure S2). CSNK2A2) and regulatory subunit CSNK2B at the
Despite the limited impact of mutations and CNAs mRNA expression level in these NSCLC subtypes (data
on individual CSNK2 subunits, mRNA overexpression not shown).
was prevalent across analyzed LUAD and LUSC To investigate potential regulatory mechanisms, we
cohorts (Figure 2A). Particularly, CSNK2A1 mRNA analyzed methylation data for putative correlations between
deregulation was found in over 90% of LUSC samples CSNK2A1-TSS200, CSNK2A2-TSS1500/1rstExon,
and 70% of LUAD samples. Overall, catalytic subunit and CSNK2B-TSS1500/1stExon/5’UTR methylation
deregulation was more prominent in LUSC than LUAD. and mRNA expression levels of CSNK2 subunits.
While CSNK2A1 consistently showed overexpression, n LUAD, we found weak negative correlations for
CSNK2A2 mRNA levels varied, with both elevated and CSNK2A2-TSS1500 (Spearman: −0.15; P = 8.658e-4)
reduced expression relative to normal-matched tissues. and CSNK2B-TSS1500/1stExon/5’UTR (Spearman:
For CSNK2B, overexpression was much more common −0.14; P = 1.528e-3) (Figure S3A). Similarly, methylation
than downregulation, with over 40% of LUAD and LUSC of CSNK2A2 and CSNK2B on promoter regions, but
samples displaying higher mRNA levels compared to not CSNK2A1, correlated with mRNA expression in
normal-matched tissues (Figure 2A). LUSC samples, with significant signals observed for
As in the pan-cancer cohorts, CSNK2A1 mRNA CSNK2A2-TSS1500 (Spearman: −0.09; P = 0.0443),
expression showed a weak positive correlation with CSNK2A2-1rstExon (Spearman: −0.10; P = 0.0368), and
Volume 3 Issue 4 (2024) 5 doi: 10.36922/td.4571