
Page 111 - TD-4-1
P. 111
Tumor Discovery HHT inhibits pancreatic cancer progress
assay. The results showed that the fluorescent intensity of mass in the HHT-pretreated group was lower than that of
PANC-1 cells treated with HHT decreased much more control group (Figure 2C), indicating that HHT-pretreated
slowly over time than that of the control (Figure 1B). cells developed tumors more slowly than the control
Specifically, the mean fluorescent intensity of PANC-1 cells cells (Figure 2D). At the same time, the tumor weight in
treated with 50 nM HHT was nearly 4-fold compared to the HHT-pretreated group was significantly decreased
the control. To determine whether the inhibitory effect compared to the control group.
persisted over time, PANC-1 cells were treated with HHT
at 25 nM or 100 nM for 24 h, followed by replenishing 3.2. HHT-induced oxidative stress and impaired
with fresh complete medium and further incubated for mitochondrial respiration in PDAC cells
another 24 or 48 h. Results showed that HHT-treated cells The intracellular ROS levels were measured using
continued to exhibit significantly higher CFSE values, DCFH-DA in PANC-1 cells treated with HHT at 50 nM
indicating that the inhibitory effect on proliferation was and 100 nM. Results showed that ROS levels remained
still evident 48 h after HHT removal (Figure 1C). unchanged during the first 6 h of HHT treatment but were
Next, crystal violet staining was used to investigate the significantly elevated after 12 h of treatment, demonstrating
effect of HHT on the colony-forming ability of PANC-1 and both dose- and time-dependent effects (Figure 3A).
Pan02-mCherry cells. Both cell lines exhibited a significant Notably, the ROS levels in the 100 nM group were much
reduction in colony formation after 48 h of incubation of higher than those in the 50 nM group at 12, 24, and 48 h.
HHT in a dose-dependent manner compared to untreated Fluorescent microscopy of cells treated with HHT for 18 h
cells (Figure 2A). Specifically, in PANC-1 cells, 25 nM (Figure 3B) confirmed these findings, showing increased
HHT inhibited colony formation by about 41%. Pan02- cellular fluorescence with HHT treatment at both 50 nM
mCherry cells exhibited greater sensitivity to HHT and 100 nM, consistent with the data in Figure 3A. At the
treatment, with the same concentration inducing about same time, NADH levels were downregulated following
54% inhibition of colony formation in reference to that of HHT treatment (Figure 3C), along with a significant
+
control (Figure 2B). The inhibitory effect of HHT on the increase of NAD /NADH ratio after 48 h of HHT treatment
tumorigenic capacity of Pan02-mCherry cells was also at 50 nM or 100 nM (Figure 3D), clearly indicating a state
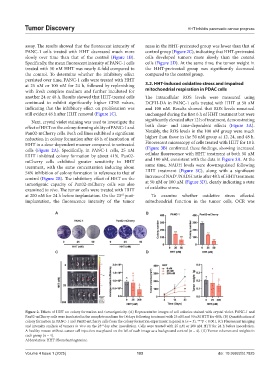
examined in vivo. The tumor cells were treated with HHT of oxidative stress.
at 200 nM for 24 h before implantation. On the 23 post- To examine whether oxidative stress affected
rd
implantation, the fluorescence intensity of the tumor mitochondrial function in the tumor cells, OCR was
A B
C D
Figure 2. Effects of HHT on colony formation and tumorigenicity. (A) Representative images of cell colonies stained with crystal violet. PANC-1 and
Pan02-mCherry cells were incubated in the complete medium for 14 days following treatment with 25 nM and 50 nM HTT for 48 h. (B) Quantification of
colony formation in PANC-1 and Pan02-mCherry cells from the colony formation experiment in panel A (n = 3). ***P < 0.001. (C) Fluorescent imaging
and intensity analysis of tumors in vivo on the 23 day after inoculation. Cells were treated with 25 nM or 200 nM HTT for 24 h before inoculation.
rd
A healthy mouse without cancer cell injection was placed on the left of each image as a background control (n = 4). (D) Tumor volumes and weights in
each group (n = 4).
Abbreviation: HHT: Homoharringtonine.
Volume 4 Issue 1 (2025) 103 doi: 10.36922/td.7825