
Page 112 - TD-4-1
P. 112
Tumor Discovery HHT inhibits pancreatic cancer progress
A
B B-1
C D
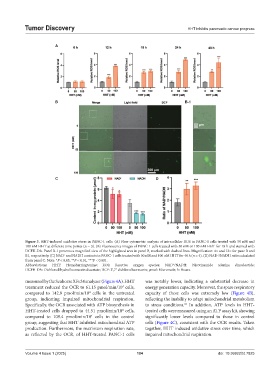
Figure 3. HHT-induced oxidative stress in PANC-1 cells. (A) Flow cytometric analysis of intracellular ROS in PANC-1 cells treated with 50 nM and
100 nM HHT at different time points (n = 3). (B) Fluorescence images of PANC-1 cells treated with 50 nM or 100 nM HHT for 18 h and stained with
DCFH-DA. Panel B-1 presents a magnified view of the highlighted area in panel B, marked with dashed lines. Magnification: 4× and 12× for pane B and
+
B1, respectively. (C) NAD and NADH contents in PANC-1 cells treated with 50 nM and 100 nM HHT for 48 h (n = 4). (D) NAD /NADH ratio calculated
+
from panel C. Note: *P < 0.05, **P < 0.01, ***P < 0.001.
+
Abbreviations: HHT: Homoharringtonine; ROS: Reactive oxygen species; NAD /NADH: Nicotinamide adenine dinucleotide;
DCFH-DA: Dichlorodihydrofluorescein diacetate; DCF: 2′,7′-dichlorofluorescein; μmol: Micromole; h: Hours.
measured by the Seahorse XFe24 analyzer (Figure 4A). HHT was notably lower, indicating a substantial decrease in
4
treatment reduced the OCR to 61.15 pmol/min/10 cells, energy generation capacity. Moreover, the spare respiratory
compared to 142.9 pmol/min/10 cells in the untreated capacity of these cells was extremely low (Figure 4B),
4
group, indicating impaired mitochondrial respiration. reflecting the inability to adapt mitochondrial metabolism
Specifically, the OCR associated with ATP biosynthesis in to stress conditions. In addition, ATP levels in HHT-
21
HHT-treated cells dropped to 44.51 pmol/min/10 cells, treated cells were measured using an ATP assay kit, showing
4
compared to 109.4 pmol/min/10 cells in the control significantly lower levels compared to those in control
4
group, suggesting that HHT inhibited mitochondrial ATP cells (Figure 4C), consistent with the OCR results. Taken
production. Furthermore, the maximum respiration rate, together, HHT induced oxidative stress over time, which
as reflected by the OCR, of HHT-treated PANC-1 cells impaired mitochondrial respiration.
Volume 4 Issue 1 (2025) 104 doi: 10.36922/td.7825