
Page 114 - TD-4-1
P. 114
Tumor Discovery HHT inhibits pancreatic cancer progress
A
B C D
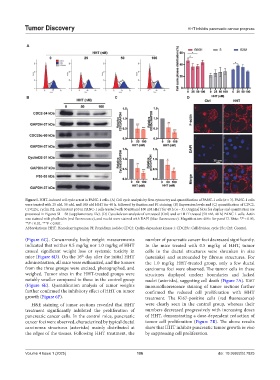
Figure 5. HHT-induced cell cycle arrest in PANC-1 cells. (A) Cell cycle analysis by flow cytometry and quantification of PANC-1 cells (n = 3). PANC-1 cells
were treated with 25 nM, 50 nM, and 100 nM HHT for 48 h, followed by fixation and PI staining. (B) Expression levels and (C) quantification of CDC2,
CDC25c, cyclin D2, and mutant p53 in PANC-1 cells treated with 50 nM and 100 nM HHT for 48 h (n = 3). Original blots for display and quantitation are
presented in Figures S1 – S8 (supplementary file). (D) Cytoskeleton analysis of untreated (Ctrl) and or HHT-treated (50 nM, 48 h) PANC-1 cells. Actin
was stained with phalloidin (red fluorescence), and nuclei were stained with DAPI (blue fluorescence). Magnification: 400× for panel D. Note: *P < 0.05,
**P < 0.01, ***P < 0.001.
Abbreviations: HHT: Homoharringtonine; PI: Propidium iodide; CDC2: Cyclin-dependent kinase 1: CDC25c: Cell division cycle 25c; Ctrl: Control.
(Figure 6C). Concurrently, body weight measurements number of pancreatic cancer foci decreased significantly.
indicated that neither 0.5 mg/kg nor 1.0 mg/kg of HHT In the mice treated with 0.5 mg/kg of HHT, tumor
caused significant weight loss or systemic toxicity in cells in the ductal structures were shrunken in size
mice (Figure 6D). On the 16 day after the initial HHT (asterisks) and surrounded by fibrous structures. For
th
administration, all mice were euthanized, and the tumors the 1.0 mg/kg HHT-treated group, only a few ductal
from the three groups were excised, photographed, and carcinoma foci were observed. The tumor cells in these
weighed. Tumor sizes in the HHT-treated groups were structures displayed unclear boundaries and lacked
notably smaller compared to those in the control group nuclei (asterisks), suggesting cell death (Figure 7A). Ki67
(Figure 6E). Quantification analysis of tumor weights immunofluorescence staining of tumor sections further
further confirmed the inhibitory effect of HHT on tumor confirmed the reduced cell proliferation with HHT
growth (Figure 6F). treatment. The Ki67-positive cells (red fluorescence)
H&E staining of tumor sections revealed that HHT were clearly seen in the control group, whereas their
treatment significantly inhibited the proliferation of numbers decreased progressively with increasing doses
pancreatic cancer cells. In the control mice, pancreatic of HHT, demonstrating a dose-dependent reduction of
cancer foci were observed, characterized by typical ductal tumor cell proliferation (Figure 7B). The above results
carcinoma structures (asterisks) mainly distributed at show that HHT inhibits pancreatic tumor growth in vivo
the edges of the tissues. Following HHT treatment, the by suppressing cell proliferation.
Volume 4 Issue 1 (2025) 106 doi: 10.36922/td.7825