
Page 92 - TD-4-1
P. 92
Tumor Discovery Identification of a potential KRAS(G12C) inhibitor
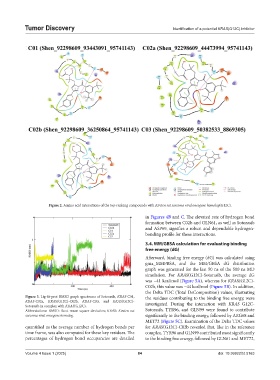
Figure 2. Amino acid interactions of the top-ranking compounds with Kirsten rat sarcoma viral oncogene homolog(G12C).
in Figures 4B and C. The elevated rate of hydrogen bond
formation between C02b and GLN61, as well as Sotorasib
and ASP69, signifies a robust and dependable hydrogen-
bonding profile for these interactions.
3.4. MM/GBSA calculation for evaluating binding
free energy (dG)
Afterward, binding free energy (dG) was calculated using
gmx_MMPBSA, and the MM/GBSA dG distribution
graph was generated for the last 50 ns of the 500 ns MD
simulation. For KRAS(G12C)-Sotorasib, the average dG
was −41 kcal/mol (Figure 5A), whereas for KRAS(G12C)-
C02b, this value was −44 kcal/mol (Figure 5B). In addition,
the Delta TDC (Total DeComposition) values, illustrating
Figure 3. Lig-fit-prot RMSD graph spectrums of Sotorasib, KRAS-C01, the residues contributing to the binding free energy, were
KRAS-C02a, KRAS(G12C)-C02b, KRAS-C03, and KRAS(G12C)- investigated. During the interaction with KRAS G12C-
Sotorasib in complex with KRAS(G12C).
Abbreviations: RMSD: Root-mean-square deviation; KRAS: Kirsten rat Sotorasib, TYR96, and GLN99 were found to contribute
sarcoma viral oncogene homolog. significantly to the binding energy, followed by ARG68 and
MET72 (Figure 5C). Examination of the Delta TDC values
quantified as the average number of hydrogen bonds per for KRAS(G12C)-C02b revealed that, like in the reference
time frame, was also computed for these key residues. The complex, TYR96 and GLN99 contributed most significantly
percentages of hydrogen bond occupancies are detailed to the binding free energy, followed by GLN61 and MET72,
Volume 4 Issue 1 (2025) 84 doi: 10.36922/td.5163