
Page 94 - TD-4-1
P. 94
Tumor Discovery Identification of a potential KRAS(G12C) inhibitor
A B
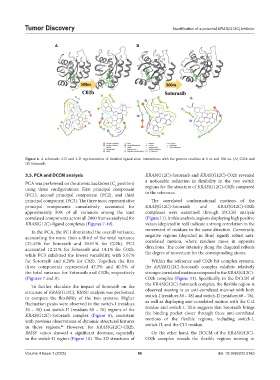
Figure 6. A schematic 2-D and 3-D representation of detailed ligand atom interactions with the protein residues at 0 ns and 500 ns. (A) C02b and
(B) Sotorasib.
3.5. PCA and DCCM analysis KRAS(G12C)-Sotorasib and KRAS(G12C)-C02b revealed
PCA was performed on the atomic backbone (C position) a noticeable reduction in flexibility in the two switch
α
using three configurations: First principal component regions for the structure of KRAS(G12C)-C02b compared
(PC1), second principal component (PC2), and third to the reference.
principal component (PC3). The three most representative The correlated conformational motions of the
principal components cumulatively accounted for KRAS(G12C)-Sotorasib and KRAS(G12C)-C02b
approximately 50% of all variances among the least complexes were examined through DCCM analysis
correlated components across all 2000 frames analyzed for (Figure 11). In this analysis, regions displaying high positive
KRAS(G12C)-ligand complexes (Figures 7-10). values (depicted in red) indicate a strong correlation in the
In the PCA, the PC1 dominated the overall variance, movement of residues in the same direction. Conversely,
accounting for more than a third of the total variance negative regions (depicted in blue) signify robust anti-
(25.45% for Sotorasib and 20.01% for C02b). PC2 correlated motion, where residues move in opposite
accounted 12.21% for Sotorasib and 14.1% for C02b, directions. The color intensity along the diagonal reflects
while PC3 exhibited the lowest variability, with 5.67% the degree of movement for the corresponding atoms.
for Sotorasib and 6.28% for C02b. Together, the first Within the reference and C02b hit complex systems,
three components represented 43.3% and 40.5% of the KRAS(G12C)-Sotorasib complex exhibits relatively
the total variance for Sotorasib and C02b, respectively stronger correlated motions compared to the KRAS(G12C)-
(Figures 7 and 9). C02b complex (Figure 11). Specifically, in the DCCM of
To further elucidate the impact of Sotorasib on the the KRAS(G12C)-Sotorasib complex, the flexible region is
structure of KRAS(G12C), RMSF analysis was performed observed moving in an anti-correlated manner with both
to compare the flexibility of the two systems. Higher switch-I (residues 30 – 38) and switch-II (residues 60 – 76),
fluctuation peaks were observed in the switch-I (residues as well as displaying anti-correlated motion with the C12
30 – 38) and switch-II (residues 60 – 76) regions of the residue and switch-I. This suggests that Sotorasib brings
KRAS(G12C)-Sotorasib complex (Figure 8), consistent the binding pocket closer through these anti-correlated
with previous observations of dynamic structural features motions of the flexible regions, including switch-I,
in those regions. However, for KRAS(G12C)-C02b, switch-II, and the C12 residue.
46
RMSF values showed a significant decrease, especially On the other hand, the DCCM of the KRAS(G12C)-
in the switch-II region (Figure 10). The 3D structures of C02b complex reveals the flexible regions moving in
Volume 4 Issue 1 (2025) 86 doi: 10.36922/td.5163