
Page 95 - TD-4-1
P. 95
Tumor Discovery Identification of a potential KRAS(G12C) inhibitor
an anti-correlated manner with switch-I and switch-II, compared to the KRAS(G12C)-Sotorasib complex.
although the dynamic movement is less pronounced Notably, there is no observed movement of the C12 residue
in the KRAS(G12C)-C02b complex. These findings suggest
a distinctive dynamic behavior in the correlated motions
of the flexible loops and associated residues between the
two complexes, highlighting the unique characteristics of
Sotorasib and C02b interactions with KRAS(G12C).
The interaction analysis revealed notable differences
between C02b and Sotorasib in their binding to the
KRAS(G12C). C02b forms a strong and persistent
interaction with GLN61 within the switch-II region, a key
flexible loop implicated in KRAS conformational dynamics.
In contrast, Sotorasib predominantly interacts with ARG68
and ASP69 in the same region. These interactions were
validated through hydrogen bond occupancy analysis,
which highlighted the stability and significance of the
C02b-GLN61 interaction throughout the MD simulations.
This distinct binding pattern of C02b suggests a potential
alteration in the modulation of KRAS’s switch regions
compared to Sotorasib, which may influence downstream
signaling pathways.
Furthermore, PCA and DCCM analyses demonstrated
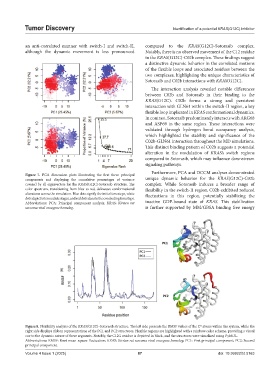
Figure 7. PCA dimension plots illustrating the first three principal
components and displaying the cumulative percentages of variance unique dynamic behavior for the KRAS(G12C)-C02b
covered by all eigenvectors for the KRAS(G12C)-Sotorasib structure. The complex. While Sotorasib induces a broader range of
color spectrum, transitioning from blue to red, delineates conformational flexibility in the switch-II region, C02b exhibited reduced
alterations across the simulation. Blue dots signify the initial timesteps, white fluctuations in this region, potentially stabilizing the
dots depict intermediate stages, and red dots denote the concluding timesteps.
Abbreviations: PCA: Principal component analysis; KRAS: Kirsten rat inactive GDP-bound state of KRAS. This stabilization
sarcoma viral oncogene homolog. is further supported by MM/GBSA binding free energy
Figure 8. Flexibility analysis of the KRAS(G12C)-Sotorasib structure. The left side presents the RMSF values of the C atoms within the system, while the
α
right side displays ribbon representations of the PC1 and PC2 structures. Flexible regions are highlighted with a rainbow color scheme, providing a visual
cue to the dynamic nature of these segments. Notably, the C12G residue is depicted in black, and the structures were visualized using PyMOL.
Abbreviations: RMSF: Root mean-square fluctuation; KRAS: Kirsten rat sarcoma viral oncogene homolog; PC1: First principal component; PC2: Second
principal component.
Volume 4 Issue 1 (2025) 87 doi: 10.36922/td.5163