
Page 96 - TD-4-1
P. 96
Tumor Discovery Identification of a potential KRAS(G12C) inhibitor
calculations, which confirm the preservation of strong
binding interactions for both compounds but with distinct
residue-specific contributions.
4. Discussion
In this study, we present potential KRAS(G12C) inhibitors
identified through a comprehensive approach involving
covalent docking-based virtual screening and MD
simulations. Our strategy started with a similarity search
based on the scaffold of Sotorasib, which successfully
identified 174 molecules from a vast pool of compounds.
Subsequently, covalent docking-based virtual screening
was performed, revealing promising KRAS(G12C) protein
binders, namely, C01, C02a, C02b, and C03. To assess the
stability of the identified complexes and putative binders,
MD simulations were employed. Significantly, among the
candidates, C02b demonstrated exceptional stability as an
inhibitor targeting the KRAS(G12C) during the 500 ns MD
simulation, comparable to the reference.
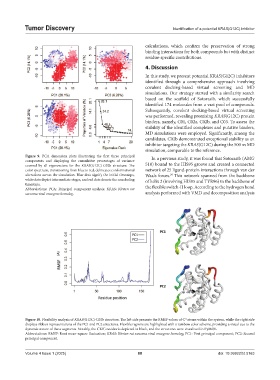
Figure 9. PCA dimension plots illustrating the first three principal In a previous study, it was found that Sotorasib (AMG
components and displaying the cumulative percentages of variance
covered by all eigenvectors for the KRAS(G12C)-C02b structure. The 510) bound to the HIS95 groove and created a connected
color spectrum, transitioning from blue to red, delineates conformational network of 25 ligand-protein interactions through van der
alterations across the simulation. Blue dots signify the initial timesteps, Waals forces. This network spanned from the backbone
29
white dots depict intermediate stages, and red dots denote the concluding of helix 2 (involving HIS95 and TYR96) to the backbone of
timesteps.
Abbreviations: PCA: Principal component analysis; KRAS: Kirsten rat the flexible switch-II loop. According to the hydrogen bond
sarcoma viral oncogene homolog. analysis performed with VMD and decomposition analysis
α
Figure 10. Flexibility analysis of KRAS(G12C)-C02b structure. The left side presents the RMSF values of C atoms within the system, while the right side
displays ribbon representations of the PC1 and PC2 structures. Flexible regions are highlighted with a rainbow color scheme, providing a visual cue to the
dynamic nature of these segments. Notably, the C12G residue is depicted in black, and the structures were visualized in PyMOL.
Abbreviations: RMSF: Root mean-square fluctuation; KRAS: Kirsten rat sarcoma viral oncogene homolog; PC1: First principal component; PC2: Second
principal component.
Volume 4 Issue 1 (2025) 88 doi: 10.36922/td.5163