
Page 93 - TD-4-1
P. 93
Tumor Discovery Identification of a potential KRAS(G12C) inhibitor
A B
C
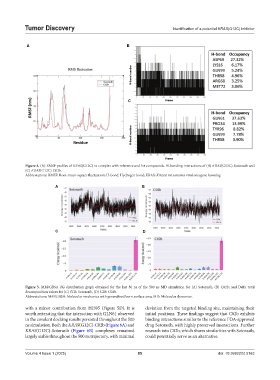
Figure 4. (A) RMSF profiles of KRAS(G12C) in complex with reference and hit compounds. H-bonding interactions of (B) KRAS(G12C)-Sotorasib and
(C) KRAS(G12C)-C02b.
Abbreviations: RMSF: Root-mean-square fluctuation; H-bond: Hydrogen bond; KRAS: Kirsten rat sarcoma viral oncogene homolog.
A B
C D
Figure 5. MM/GBSA dG distribution graph obtained for the last 50 ns of the 500 ns MD simulation for (A) Sotorasib, (B) C02b; and Delta total
decomposition values for (C) STR: Sotorasib, (D) C2B: C02b.
Abbreviations: MM/GBSA: Molecular mechanics with generalized born surface area; MD: Molecular dynamics.
with a minor contribution from HIS95 (Figure 5D). It is deviation from the targeted binding site, maintaining their
worth reiterating that the interaction with GLN61 observed initial positions. These findings suggest that C02b exhibits
in the covalent docking results persisted throughout the 500 binding interactions similar to the reference FDA-approved
ns simulation. Both the KRAS(G12C)-C02b (Figure 6A) and drug Sotorasib, with highly preserved interactions. Further
KRAS(G12C)-Sotorasib (Figure 6B) complexes remained research into C02b, which shares similarities with Sotorasib,
largely stable throughout the 500 ns trajectory, with minimal could potentially serve as an alternative.
Volume 4 Issue 1 (2025) 85 doi: 10.36922/td.5163