
Page 45 - TD-4-3
P. 45
Tumor Discovery HRD genomic alterations in Chinese NSCLC
genes often occur simultaneously, suggesting potential of downregulated genes. This suggests that HRD-H may
synergistic effects among these genes. Particularly, the suppress certain transcriptional programs, potentially
concurrent mutations in the ERCC3 and TSC2 genes, as linked to genomic instability caused by homologous
well as the co-mutations in the MSH6 and FANCM genes, recombination defects. Heatmaps (Figure 2B and D)
demonstrated significant statistical importance (p<0.01) validated these findings, demonstrating consistent
(Figure 1B). expression patterns of DEGs across distinct samples. These
results highlight systematic transcriptomic disparities
3.2. The relationship between clinicopathological between HRD-H and HRD-L subgroups, underscoring
characters and the HRD score in NSCLC their potential as biomarkers for NSCLC stratification.
To further illustrate the clinical value of HRD score
in NSCLC, we analyzed the relationship between 3.3. Genetic alterations between HRD-H and HRD-L
clinicopathological characteristics and HRD score patients in LUAD
(Figure 1A). Patients with advanced-stage (stage III and To gain deeper insights into the genomic alteration
above) NSCLC are more likely to have high HRD scores spectrum associated with the HRD phenotype in LUAD
compared to those with early-stage (stage I and II) disease patients, we assessed and contrasted the frequencies of
(Table 1), but not in the TCGA cohort. Furthermore, gene mutations between individuals classified within
individuals with LUSC have a higher incidence of HRD than HRD-H and HRD-L groups. EGFR and TP53 were the
patients with LUAD, which was consistent with the TCGA most commonly mutated genes in both the HRD-H and
cohort. No significant differences in clinical characteristics, HRD-L groups (Figure 3A). In the HRD-H group, 10 out of
including age, smoking history, and gender, were observed 14 cases exhibited mutations in the EGFR gene. TP53 gene
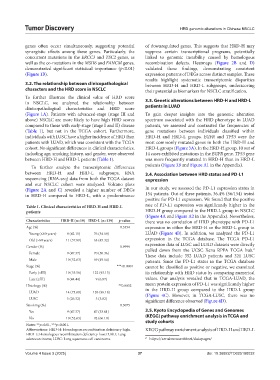
between HRD-H and HRD-L patients (Table 1). was more frequently mutated in HRD-H than in HRD-L
To further analyze the transcriptomic differences patients (Figure 3B and Figure A1 in the Appendix).
between HRD-H and HRD-L subgroups, RNA 3.4. Association between HRD status and PD-L1
sequencing (RNA-seq) data from both the TCGA dataset expression
and our NSCLC cohort were analyzed. Volcano plots
(Figure 2A and C) revealed a higher number of DEGs In our study, we assessed the PD-L1 expression status in
in HRD-H compared to HRD-L, with a predominance 154 patients. Out of these patients, 36.4% (56/154) tested
positive for PD-L1 expression. We found that the positive
Table 1. Clinical characteristics of HRD‑H and HRD‑L rate of PD-L1 expression was significantly higher in the
patients HRD-H group compared to the HRD-L group in NSCLC
(Figure 4A and Figure A2 in the Appendix). Nevertheless,
Characteristics HRD‑H (n=19) HRD‑L (n=139) p‑value there was no correlation of HRD phenotype with PD-L1
Age (%) 0.3354 expression in either the HRD-H or the HRD-L group in
Young (≤60 years) 8 (42.11) 76 (54.68) LUAD (Figure 4B). In addition, we analyzed the PD-L1
Old (>60 years) 11 (57.89) 63 (45.32) expression in the TCGA database. The TCGA PD-L1
Gender (%) 0.9999 expression data of LUSC and LUAD datasets were directly
pulled down from the UCSC Xena RPPA TCGA hub.
2
Female 9 (47.37) 70 (50.36) These data include 352 LUAD patients and 321 LUSC
Male 10 (52.63) 69 (49.64) patients. Since the PD-L1 status in the TCGA database
Stage (%) ***<0.0001 cannot be classified as positive or negative, we examined
Early (<III) 10 (55.56) 122 (93.13) its relationship with HRD status by comparing numerical
Late (≥III) 8 (44.44) 9 (6.87) values. Our analysis revealed that in TCGA-LUAD, the
Histology (%) **0.0032 mean protein expression of PD-L1 was significantly higher
LUAD 14 (73.68) 126 (96.18) in the HRD-H group compared to the HRD-L group
(Figure 4C). However, in TCGA-LUSC, there was no
LUSC 5 (26.32) 5 (3.82) significant difference observed (Figure 4D).
Smoking (%) 0.3075
Yes 9 (47.37) 47 (33.81) 3.5. Kyoto Encyclopedia of Genes and Genomes
No 10 (52.63) 92 (66.19) (KEGG) pathway enrichment analysis in TCGA and
Notes: **p<0.01, ***p<0.001. study cohorts
Abbreviations: HRD-H: Homologous recombination deficiency-high; KEGG pathway enrichment analysis of HRD-H and HRD-L
HRD-L: Homologous recombination deficiency-low; LUAD: Lung
adenocarcinoma; LUSC: Lung squamous cell carcinoma. 2 https://xenabrowser##net/datapages/
Volume 4 Issue 3 (2025) 37 doi: 10.36922/TD025180032