
Page 15 - manuscript_ijb05583
P. 15
For this, videos of the microscaffolds were recorded in flow at 20, 40 and 60 mbar fluid
19
pressure and evaluated using the TrackMate plugin within Fiji (Figure 4k). The single tracks
were then analyzed to derive a mean microscaffold velocity in mm/s and approximated via
linear regression by the formula y = 3.614x + 48.569, where X denoted the fluid pressure in
mbar and y the resulting microscaffold velocity in mm/s (Figure 4l). The error bars showed a
flow speed standard deviation of 3%, 5% and 7% at 20 mbar, 40 mbar and 60 mbar respectively.
Timing offsets between BB detection and channel seclusion of 304 ms, 218 ms and 143 ms
were calculated for fluid pressures of 20, 40 and 60 mbar, respectively. As the on-chip valves
required a response time of around 100 ms to fully react to the electronic signal, the timing
offsets were reduced by 100 ms, leading to the final values of 204 ms, 118 ms and 43 ms for
the three fluid pressures respectively.
A timing offset of 200 ms at a fluid pressure of 20 mbar was also determined experimentally
(by reducing the offset until buckyballs could be sorted repeatably) and thereby confirms the
results derived from particle tracking. The timing offsets were described as a linear function of
the fluid pressure and were approximated to the formula via linear regression y = -4.035x +
283.341, whereas x is the fluid pressure in mbar and y the path delay before switching the valve
in ms. Linear regression was chosen as linear correlation between particle velocity and sheath
23
flow velocity was reported in the literature . The BB velocity and the respective timing offsets
are summarized in Figure 4l.
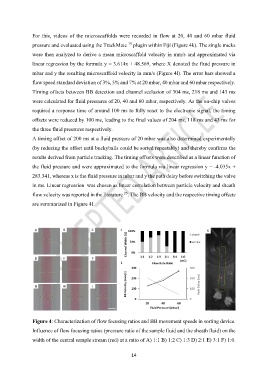
Figure 4: Characterization of flow focusing ratios and BB movement speeds in sorting device.
Influence of flow focusing ratios (pressure ratio of the sample fluid and the sheath fluid) on the
width of the central sample stream (red) at a ratio of A) 1:1 B) 1:2 C) 1:3 D) 2:1 E) 3:1 F) 1:0.
14