
Page 36 - AC-3-2
P. 36
Arts & Communication Business models transformation in the creative industries
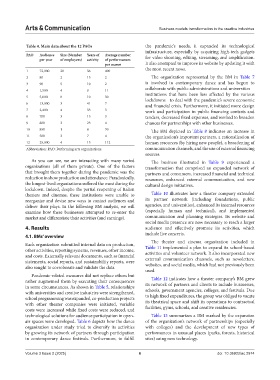
Table 4. Main data about the 12 PAOs the pandemic’s needs, it expanded its technological
infrastructure, especially by acquiring high-tech gadgets
PAO Audience Size (Number Years of Average number for video shooting, editing, streaming, and amplification.
per year of employees) activity of performances
per season It also attempted to improve its website by updating it with
1 72,000 20 36 400 the most recent news.
2 80 2 13 2 The organization represented by the BM in Table 7
3 90 5 10 2 is involved in contemporary dance and has begun to
collaborate with public administrations and universities—
4 1,500 4 9 11
5 5,000 8 10 30 institutions that have been less affected by the various
lockdowns—to deal with the pandemic’s severe economic
6 13,000 3 41 7 and financial crisis. Furthermore, it initiated more design
7 2,400 4 33 3 work and participation in public financing contests and
8 700 3 15 3 tenders, decreased fixed expenses, and worked to broaden
9 800 3 23 4 chances for partnerships with other businesses.
10 850 1 8 70 The BM depicted in Table 8 indicates an increase in
11 500 3 7 4 the organization’s important partners, a rationalization of
12 25,000 4 13 112 human resources (by hiring new people), a broadening of
Abbreviation: PAO: Performing arts organizations. communication channels, and the use of external financing
sources.
As you can see, we are interacting with many varied The business illustrated in Table 9 experienced a
organizations (all of them private). One of the factors transformation that comprised an expanded network of
that brought them together during the pandemic was the partners and consumers, increased financial and technical
reduction in show production and attendance. Paradoxically, resources, enhanced external communication, and new
the longest-lived organizations suffered the most during the cultural design initiatives.
lockdown. Indeed, despite the partial reopening of Italian
theaters and cinemas, these institutions were unable to Table 10 illustrates how a theater company extended
reorganize and devise new ways to contact audiences and its partner network (including foundations, public
deliver their plays. In the following BM analysis, we will agencies, and universities), enhanced its internal resources
examine how these businesses attempted to re-enter the (especially human and technical), and implemented
market and differentiate their activities (and earnings). communication and planning strategies. Its website and
social media presence are now necessary to reach a larger
4. Results audience and effectively promote its activities, which
include live concerts.
4.1. BMs’ overview
The theater and cinema organization included in
Each organization submitted internal data on production, Table 11 implemented a plan to expand its school-based
other activities, reporting systems, revenues, other income,
and costs. Externally relevant documents, such as financial activities and volunteer network. It also incorporated new
statements, social reports, and sustainability reports, were external communication channels, such as newsletters,
also sought to corroborate and validate the data. websites, and social media, which had not previously been
used.
Pandemic-related measures did not replace others but
rather augmented them by executing their consequences Table 12 indicates how a theater company’s BM grew
in some circumstances. As shown in Table 5, relationships its network of partners and clients to include businesses,
with universities and creative industries were strengthened, schools, government agencies, colleges, and festivals. Due
school programming was expanded, co-production projects to high fixed expenditures, the group was obliged to vacate
its theatrical space and shift its operations to contractual
with other theater companies were initiated, variable
costs were increased while fixed costs were reduced, and facilities, gyms, schools, and creative residencies.
technological solutions for audience participation in open- Table 13 summarizes a BM marked by the expansion
air spaces were developed. Table 6 depicts how the dance of the organization’s network of partnerships (especially
organization under study tried to diversify its activities with colleges) and the development of new types of
by growing its network of partners through participation performances in unusual places (parks, forests, historical
in contemporary dance festivals. Furthermore, to fulfill sites) using new technology.
Volume 3 Issue 2 (2025) 6 doi: 10.36922/ac.2974