
Page 44 - AIH-1-4
P. 44
Artificial Intelligence in Health Segmentation and classification of DR using CNN
accuracy of positive predictions, ranged from 0.8161 to
0.8340. The overall accuracy of the model was consistently
high across all structures, with values ranging from 0.9922
to 0.9989, as presented in Table 2. These results collectively
underscored the efficacy of the segmentation model in
accurately delineating retinal structures, showcasing its
potential for enhancing diagnostic capabilities in the
context of retinal pathology assessment.
3.2. Image grading results
In our investigation of the APTOS dataset, we thoroughly
assessed the performance of our proposed method in
DR grading. Our method exhibited exemplary results,
achieving the highest accuracy (ACC) and kappa scores
among all evaluated methods. Specifically, our approach
attained an ACC of 89.1% and a kappa score of 93.4%, Figure 5. Training and validation accuracy. Image generated using VS
surpassing the performance of MIL-VT, which achieved code
an AUC of 97.9%. These results underscore the robustness
and effectiveness of our proposed method for accurately A
grading DR on the APTOS dataset, as presented in
Table 3. Notably, our method demonstrated competitive
performance compared to state-of-the-art models,
highlighting its potential as a reliable tool for precise DR
grading in clinical settings. 38
B
3.3. Application integration results
The proposed interface for DR detection and classification G
is designed to offer a comprehensive diagnostic platform H
by incorporating multiple segmentation techniques with C
deep learning models for fundus image analysis. Users
can interact with various features, including buttons
for triggering segmentation techniques, allowing the
identification of specific regions of interest related to D
potential DR indicators. The interface also provides the
flexibility to toggle between grayscale and normal views,
facilitating a detailed examination of fundus images in
34
different visual representations. The DR classification
E
Table 3. DR and DME grading on the IDRiD dataset 37
Methods AUS ACC F1 Kappa
DLI - 82.5 80.3 89.0 F
CANet - 83.2 81.3 90.0
GREEN-ResNet50 - 84.4 83.6 90.8
GREEN-SE-ResNext50 - 85.7 85.2 91.2
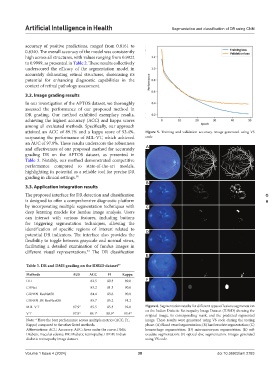
MIL-VT 97.9* 85.5 85.3 92.0 Figure 6. Segmentation results for different types of lesions segmentation
on the Indian Diabetic Retinopathy Image Dataset (IDRiD) showing the
VT 97.9* 89.1* 88.9* 93.4* original image, its corresponding mask, and the predicted segmented
Note: * Have the best performance across multiple metrics (ACC, F1, image. These results were generated using VS code during the testing
Kappa) compared to the other listed methods. phase. (A) Blood vessel segmentation; (B) hard exudate segmentation; (C)
Abbreviations: ACC: Accuracy; AUC: Area under the curve; DME: hemorrhage segmentation; (D) microaneurysm segmentation; (E) soft
Diabetic macular edema; DR: Diabetic retinopathy; IDRiD: Indian exudate segmentation; (F) optical disc segmentation. Images generated
diabetic retinopathy image dataset. using VS code.
Volume 1 Issue 4 (2024) 38 doi:10.36922/aih.2783